

Decoding the Fear and Greed Index for S&P500
Decoding the Fear and Greed Index for S&P500
A visual breakdown of its seven components - Update of SMH and its S/R Levels

The Fear Gauge: Demystifying Investor Sentiment
Have you ever wondered if the stock market is "on sale" or simply overpriced? The Fear & Greed Index aims to answer that question by measuring investor sentiment. Think of it as a thermometer for the market's emotional state.
This index operates on the principle that extreme fear leads to investors selling at low prices, while excessive greed can inflate asset prices. By analyzing a combination of seven factors, the Fear & Greed Index provides a snapshot of where the market stands – gripped by fear, fueled by optimism, or somewhere in between.
Similar to the Fear & Greed Index for stocks, alternative.me has created an index to gauge how cryptocurrency investors are feeling.
Fear Is Back
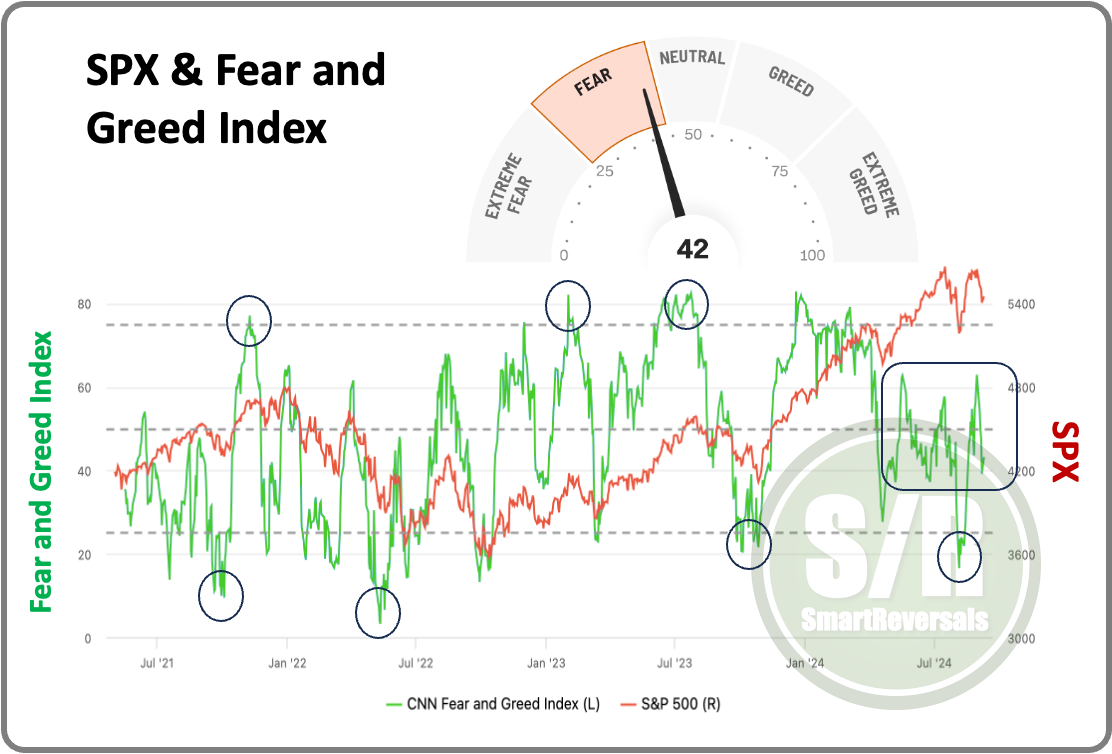
Usually the bottoms and tops in the Standard and Poor's 500 are related to extreme levels of fear on greed as circled in the chart below, where the Fear and Greed index is presented in green, and the SPX in red.
The recent bounce when August was starting was well related with extreme fear levels, the current reading is 42/100 or fear, which is in the middle range where there have been bounces during the recent months as highlighted in the square.
This indicator has to be analyzed with other technical factors, the main one will always be price action, which includes volume and candlesticks. The reading today for SPX is a Harami or inside candle that indicates indecision and a potential reversal.
The grey line is the 5 daily moving average a reference of short term trend and the arrows point out the rejections or bounces.
There are other moving averages with more relevance, but for this case a validation for a bullish reversal would be a close tomorrow above the 5DMA, and technically speaking, an opening above or at the close of today’s candle (also matching that moving average).
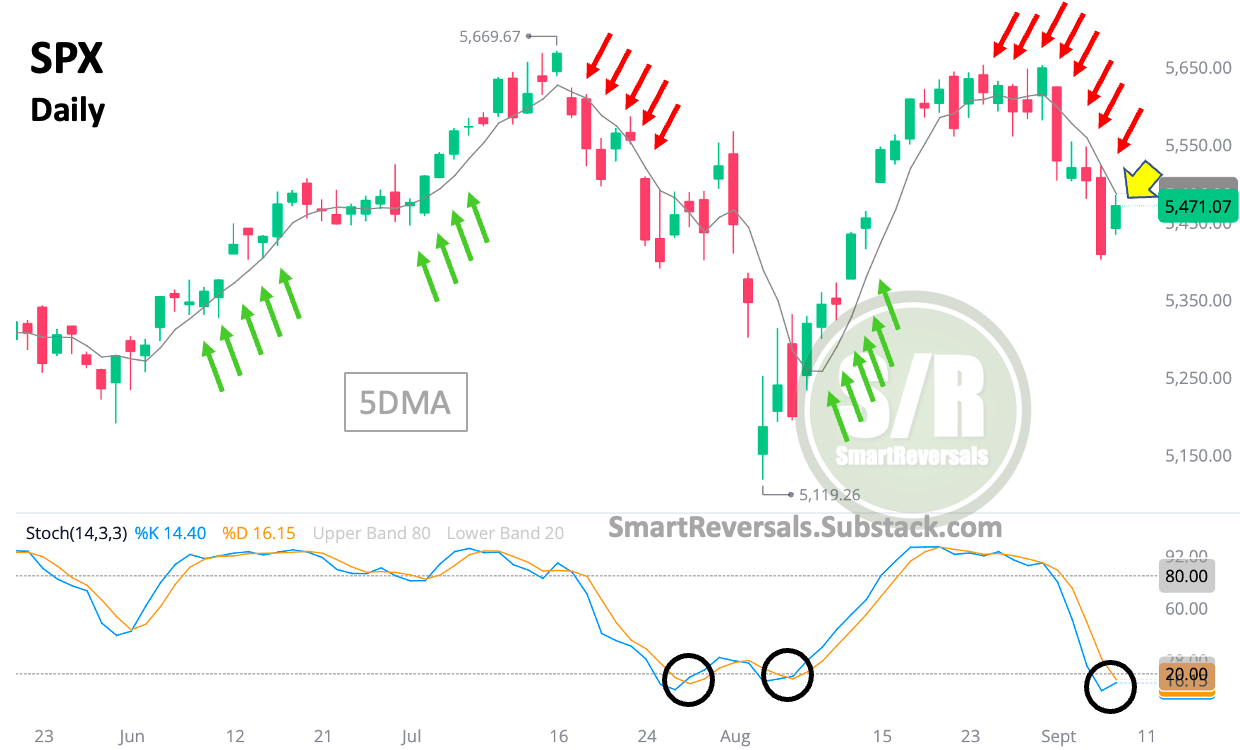
The oscillator suggests a bounce is brewing, but this also needs confirmation sealing a bullish crossover as indicated in recent days.
Most technicals can be invalidated quickly, as it actually happened with the oscillator in July, when price/candles printed false breakouts. That is why the S/R levels are so important, and $5478 is the key level to watch for SPX this week.
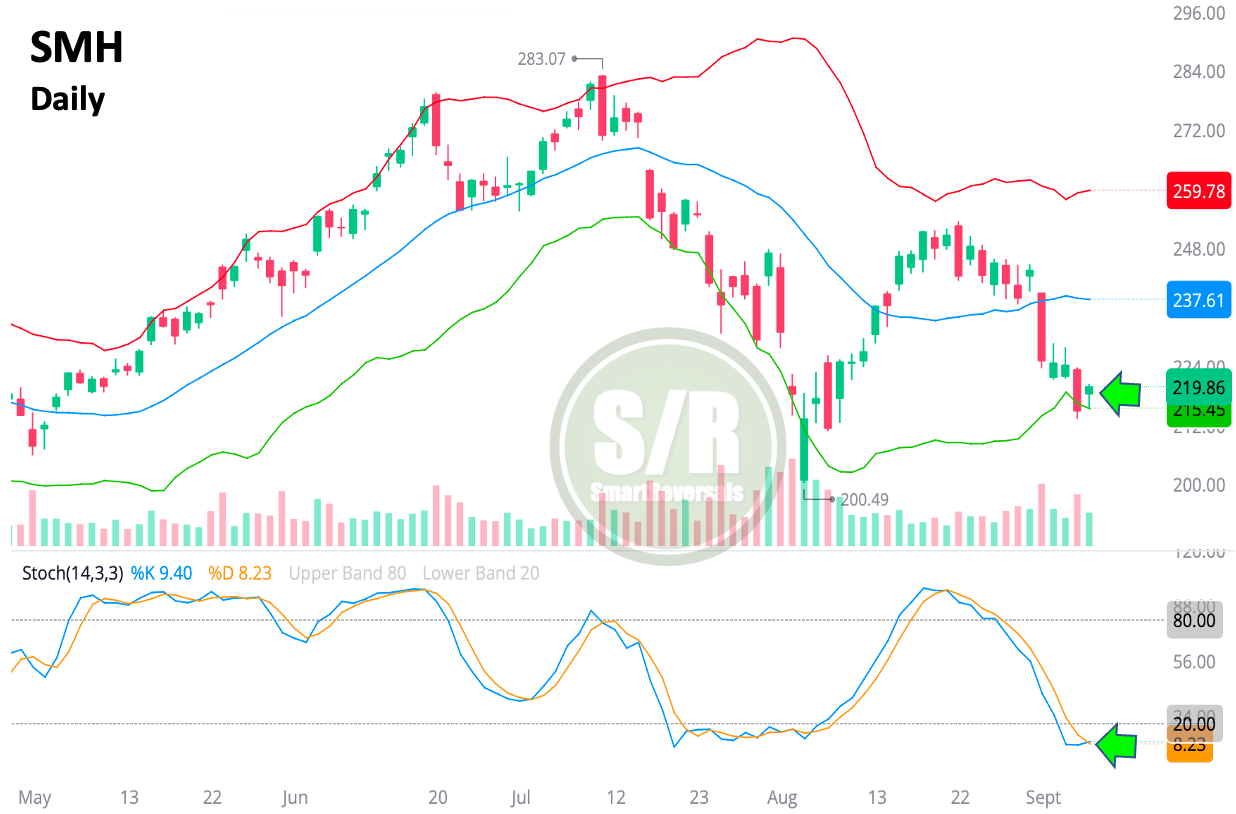
Price action, composed by candles and volume, has to be assessed to identify breakouts in any security, and for SMH, a security that we’re studying as an example of the S/R levels, $222 is the key level that once consolidated would provide a better validation of a bounce.
Let’s Analyze the Components of the Fear and Greed Index
Here's a breakdown of how the CNN Business Fear & Greed Index works: It considers seven key indicators, each given equal weight, to determine the overall level of fear or greed in the market. These indicators include things like:
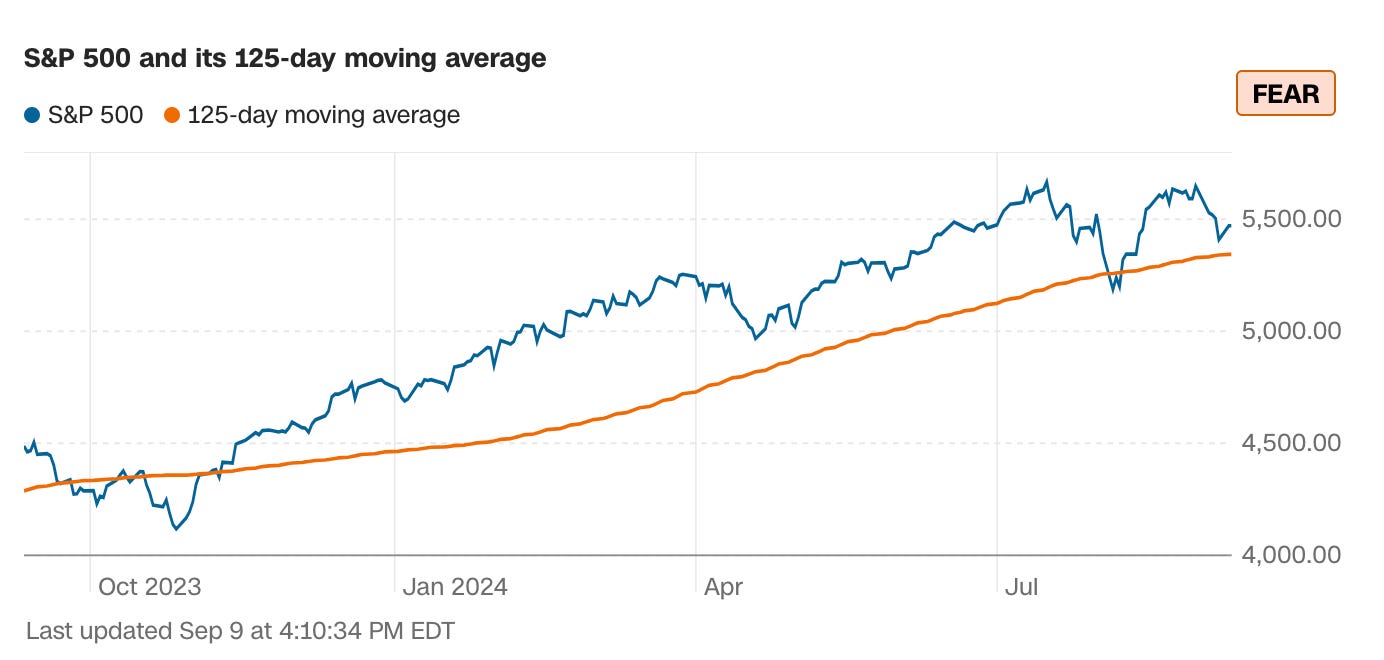
Stock price momentum: Are prices rapidly rising or falling?
To gauge stock market momentum, it's helpful to compare current levels to historical performance. If the S&P 500 is trading above its 125-day moving average, it suggests positive momentum and investor optimism. Conversely, if the index is below this average, it indicates growing investor skepticism. The Fear & Greed Index uses changes in momentum as a signal, interpreting slowing momentum as a sign of fear and increasing momentum as a sign of greed.
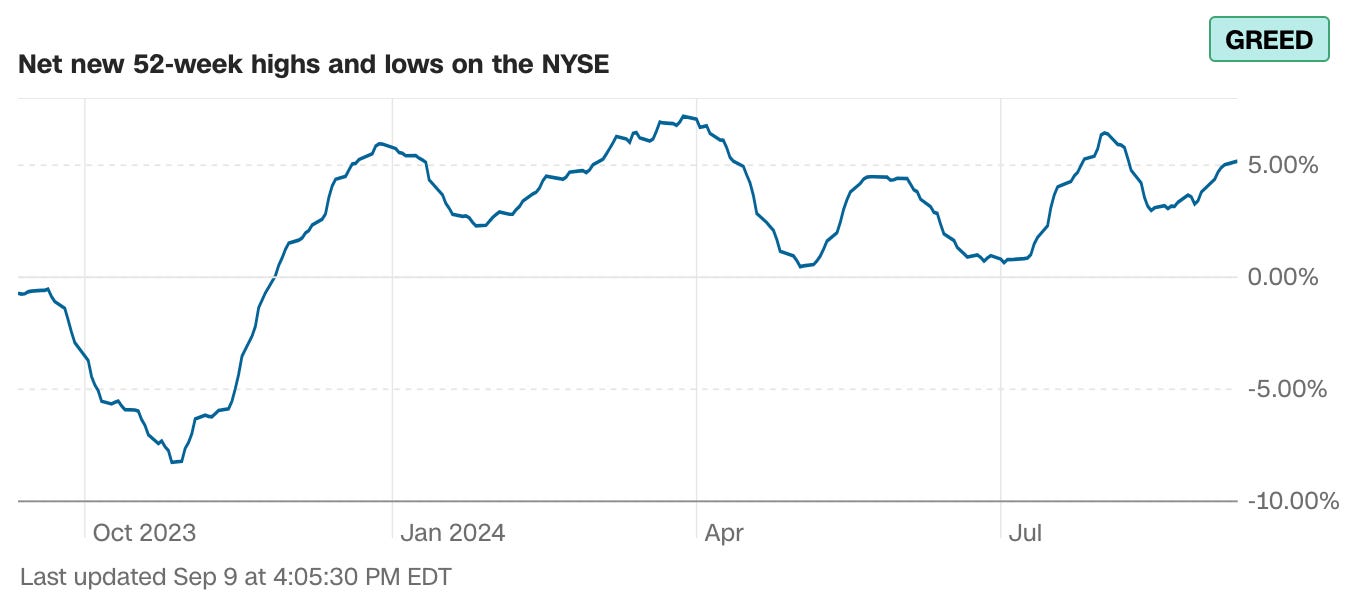
Stock price strength: How strong are individual stocks within the market?
The performance of a few large stocks can significantly impact the overall market returns. It's crucial to assess the broader market trend by examining the number of stocks performing well compared to those struggling. This can be measured by comparing the number of stocks at 52-week highs to those at 52-week lows. A higher proportion of stocks at 52-week highs indicates a bullish market sentiment and signals greed.
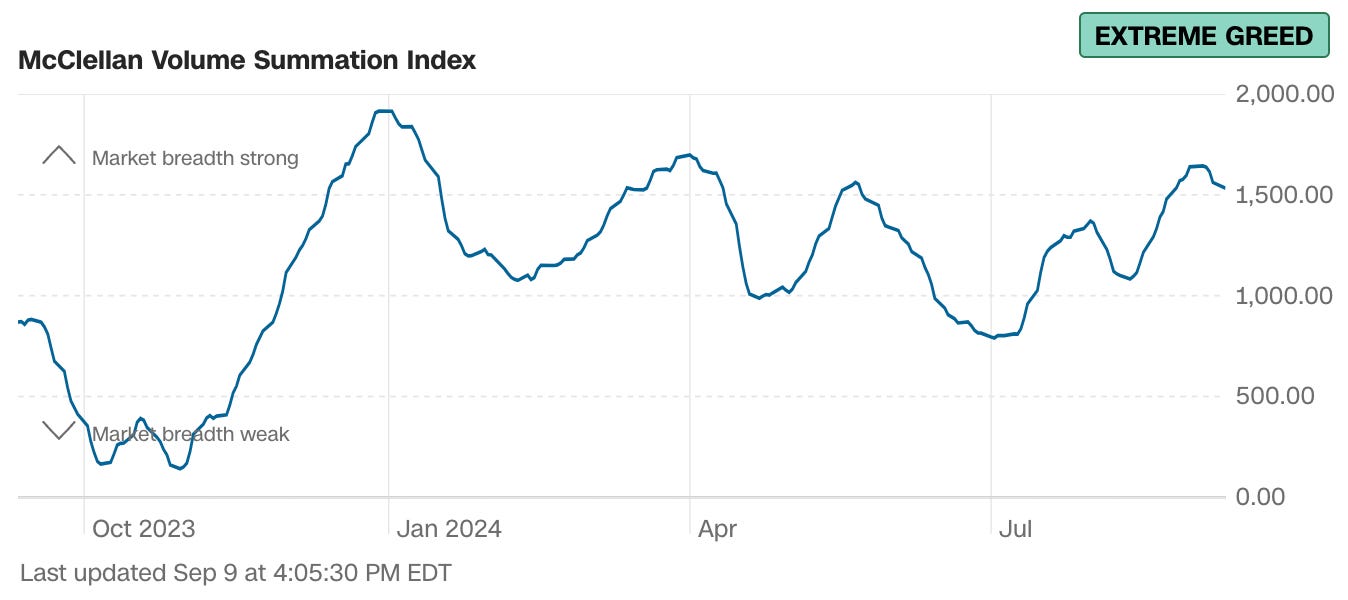
Stock price breadth: Is the movement spread across many stocks or focused on a few?
The stock market is composed of thousands of individual stocks that are actively traded daily. To assess market breadth, it's essential to analyze the volume of stocks increasing in price compared to those declining. A low or negative reading in this measure indicates a bearish market sentiment, which the Fear & Greed Index interprets as a signal of fear.
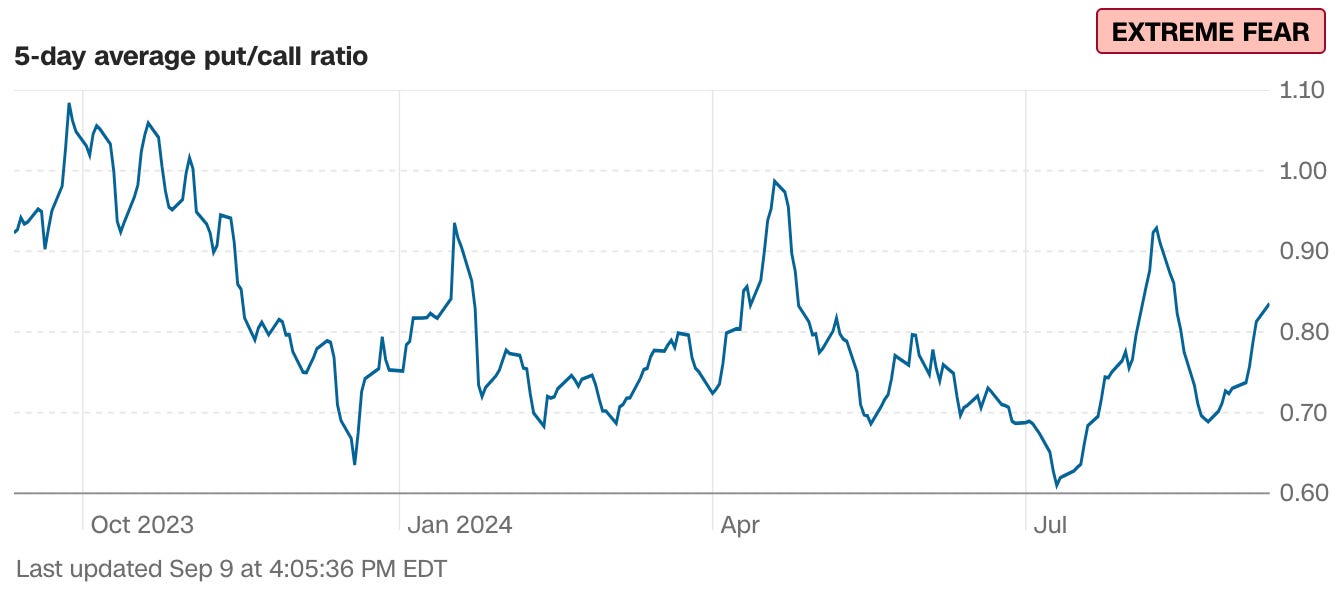
Put and call options: Are investors betting on a rise (calls) or a fall (puts) in prices?
Options are contracts that allow investors to buy or sell underlying assets like stocks or indexes at a predetermined price and time. Put options provide the right to sell, while call options grant the right to buy. A rising ratio (above 1 sometimes) of put options to call options suggests growing investor pessimism, which the Fear & Greed Index interprets as a signal of fear.
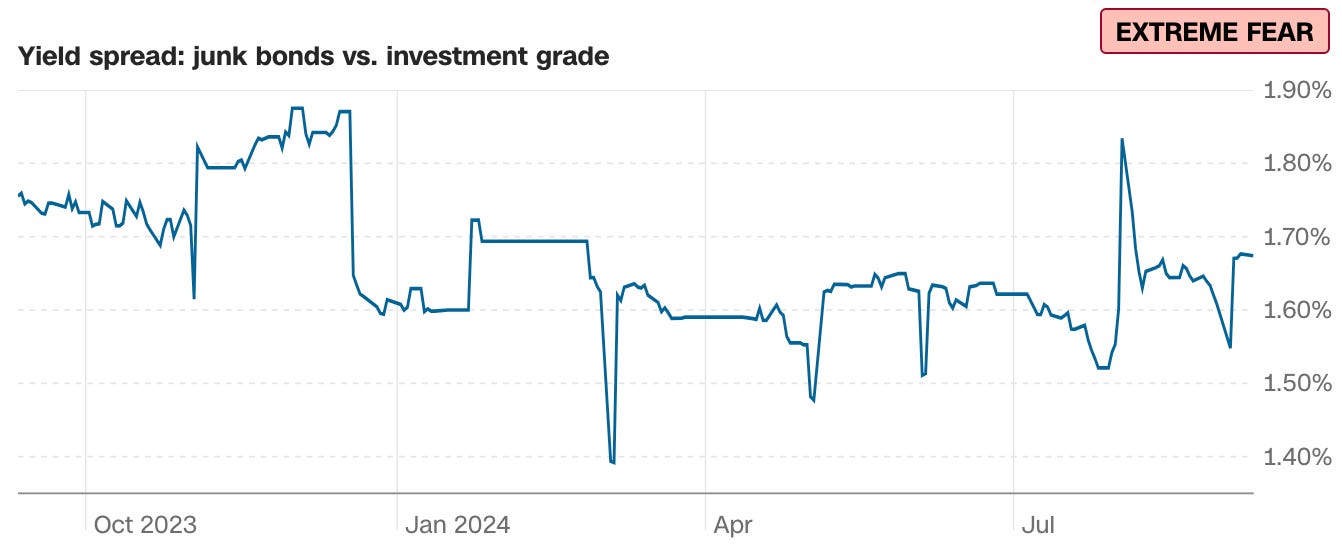
Junk bond demand: Are investors seeking risky assets, a sign of potentially excessive greed?
Junk bonds are considered riskier investments compared to other types of bonds due to their higher likelihood of default. When bond prices rise, the yields (returns) on those bonds typically decrease. If investors are actively seeking junk bonds, it suggests a higher risk appetite, often driven by greed. This increased demand can lead to lower yields on junk bonds compared to safer government bonds. Conversely, a wider spread between the yields of junk bonds and government bonds indicates that investors are more cautious and avoiding risk. The Fear & Greed Index interprets this increased caution as a signal of fear.
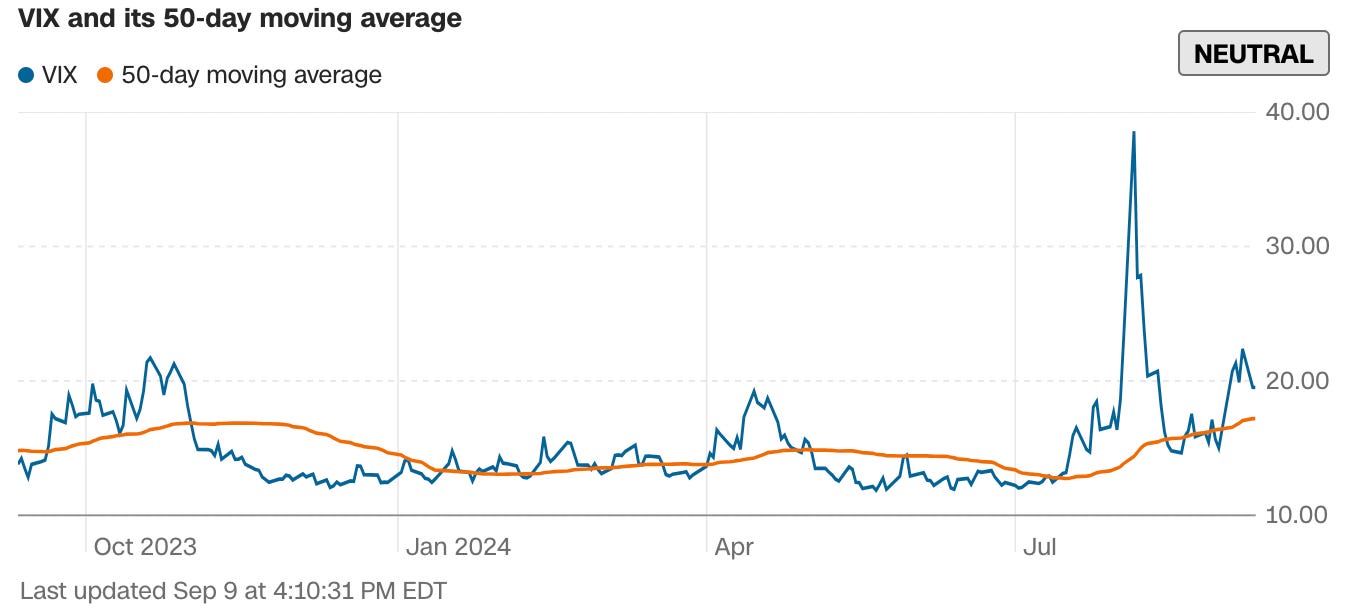
Market volatility: How much are prices fluctuating?
The CBOE Volatility Index (VIX) is a widely recognized indicator of market sentiment. It measures the anticipated price fluctuations of S&P 500 Index options within the next 30 days. The VIX typically declines during market rallies and surges during market downturns. However, the key lies in analyzing the VIX over time. It tends to be lower in bullish markets and higher during bearish periods. The Fear & Greed Index incorporates rising market volatility as a signal of fear.
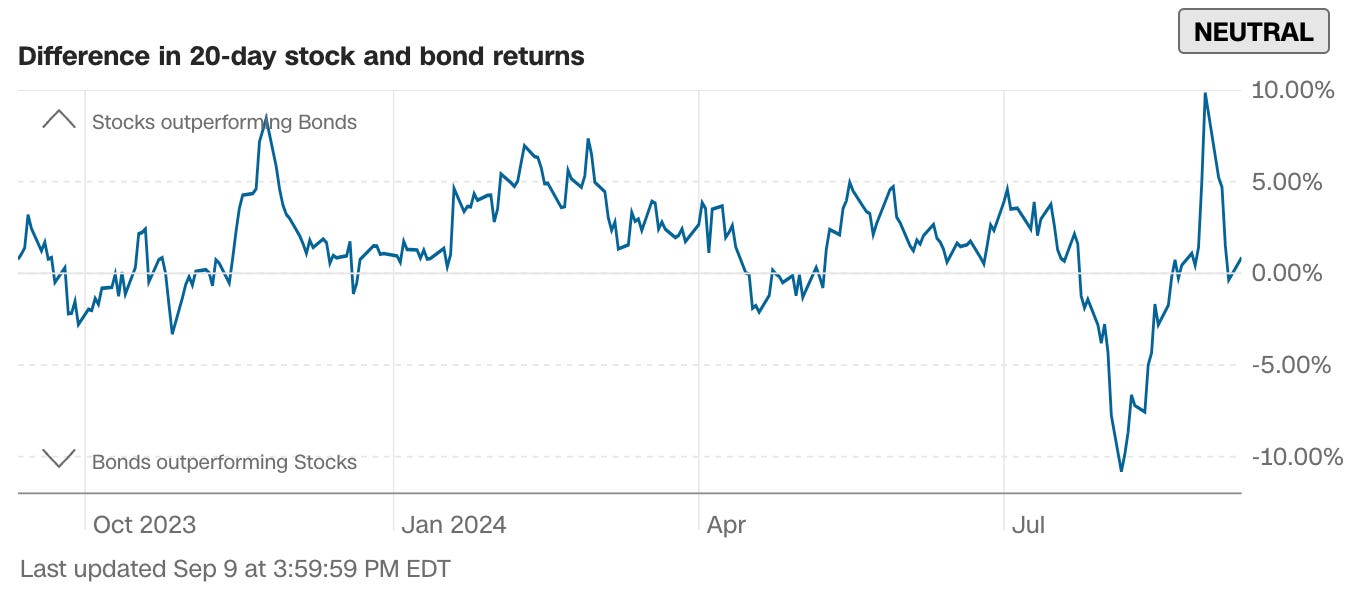
Safe-haven demand: Are investors seeking safe havens like gold, indicating fear?
Stocks are considered riskier investments than bonds, but they offer the potential for higher long-term returns. However, bonds can outperform stocks during short-term periods, especially in times of market uncertainty. The Safe Haven Demand indicator measures the difference in returns between Treasury bonds and stocks over the past 20 trading days. An increase in this indicator suggests that investors are seeking safe havens, which is often a sign of fear. The Fear & Greed Index incorporates rising safe haven demand as a signal of fear.
By analyzing this mix of factors, the Fear & Greed Index offers a valuable tool to understand investor sentiment and potentially make more informed investment decisions.

For More Information
If you want to learn more, you can access premium content about several topics that are part of the Fear and Greed Index, all the publications present fresh examples of the market:
Moving Averages

Volatility Index

Market Breadth Trilogy


Bonds

The educational content alone is worth the subscription, join the community and learn technicals with fresh examples.
This educational content is not intended to be investment advice.