

VIX Details Revealed: Don't Get Caught Off Guard by the Market's Volatility Monster
VIX Details Revealed: Don't Get Caught Off Guard by the Market's Volatility Monster
Turn Fear into Profit: Learn from Past Corrections & Bear Markets to Navigate the Current Market & Potential Moves


The bounced and pulled back today. Very short term bottoms can sometimes occur during extended market hours. That happened when ES Futures bounced in the morning from the $5042 support/resistance (S/R) level shared last Friday. As always, once a support level is broken, the next potential support becomes crucial – and in this case, the futures found support at a key weekly level.
During market hours, the SPX fell to the $5008 support level, which was also highlighted in the latest edition.
Adding S/R levels to your charts can significantly improve your ability to identify potential reversals or consolidations. For a refresher on the latest levels shared last Friday, please revisit this link:

Just imagine reading the 30 minutes, 1 hour, or 2 hours candles with the levels in your chart, an entry can be considered risking very little with a Stop order slightly below the level, that’s how they work and each person can manage the stops according to their own style, risk tolerance, and conviction. This content does not indicate where to set specific stop orders.
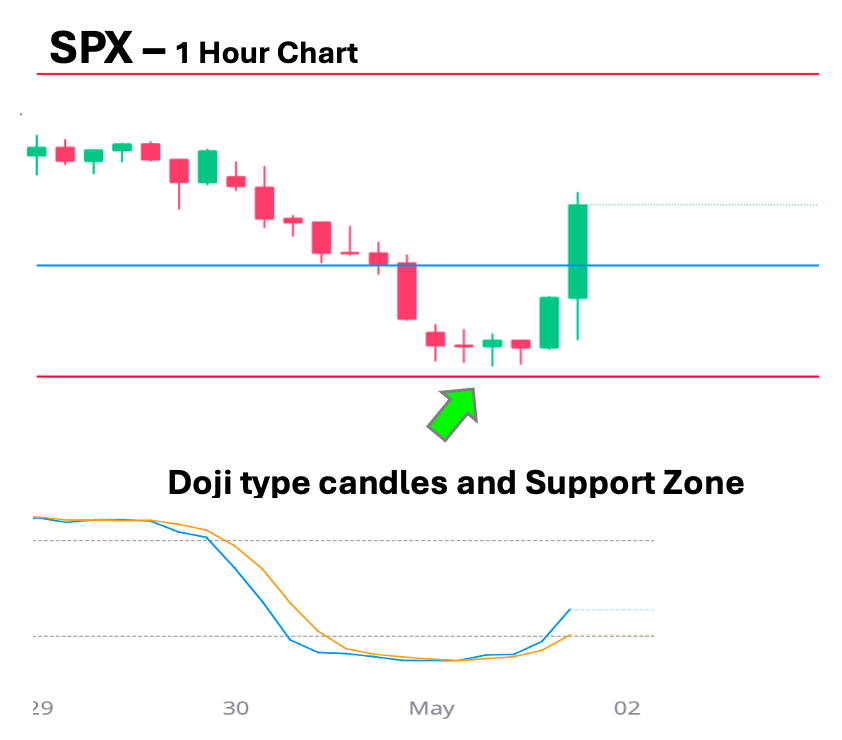
The blue line is $5061, that level was back to support position and it could be used to manage risk, mostly with high risk investment instruments like leveraged ETFs or options.
At the close, the chart is the following one, closing a long position considering $5061 would have left the trade in the green zone.

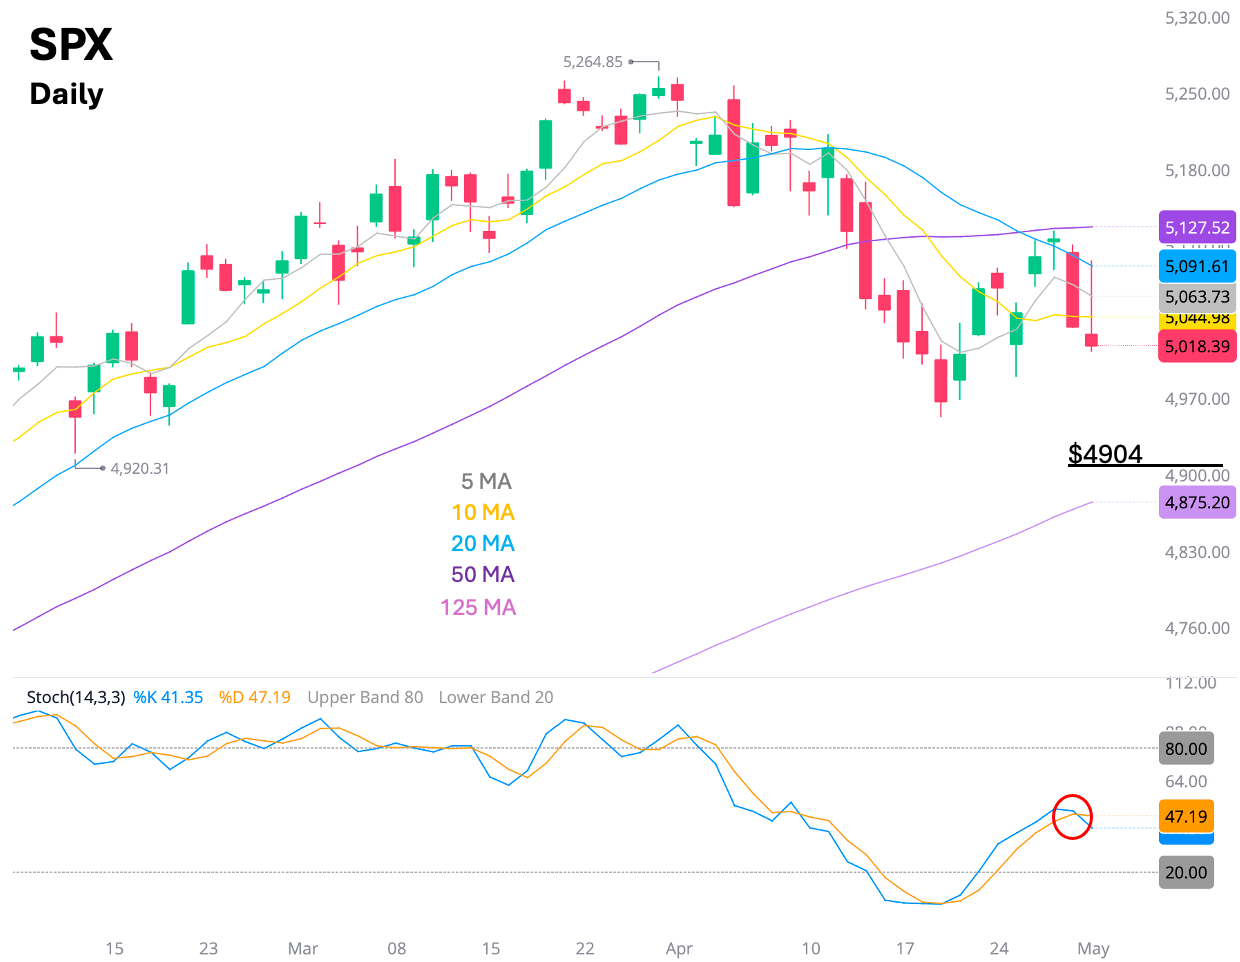
Daily Chart: This decline is being mandated by the 20 Daily Moving Average, there have been three rejections from that level during the last four trading days, Stochastic is showing a bearish crossover and most likely this move is pointing to 4904 at least.
$5008 is the nearest line of defense, but it is very close and let’s remember that the weekly setup is mostly bearish across the board.
MARKET UPDATE:
Let’s take a look to some equities analyzed in the Newsletter published during the weekend, here is the link so you can open it easily:

The the latest weekend edition anticipated very well the following moves:
TLT: Bounce thesis still in, consolidating $89.3 suggests a safer entry.
DXY: Falling as the setup suggested, $105.9 has rejected price for three weeks so far.
IWM: Bouncing well considering the multiple support levels in confluence mentioned.
GOOG: Came back to the Bollinger zone in the daily. Gap fill if $164 is lost.
AAPL: It doesn’t want to fall from the cliff charted, but it lost the key annual level, another gravestone was added today to the daily chart.
TSLA: Promising bounce as mentioned on Saturday, and the level that must be conquered is support. The bearish crossover in Stochastic is a watch out alert.
NVDA and META continue building volume at the base that is expected to be consolidated as the previous ones from 2023.
MSFT: As posted on Saturday, the bottom may be in, conquering $402 would confirm that.
GDX: During the last 3 weeks, the bearish reversal setup has not been invalidated, the monthly chart that will be published this week is screaming a top is in.
CL=F: The top thesis is more in play as on Saturday.
BITCOIN: Falling as expected, the expectation for destination is the same.
Today is holiday in Europe, STOXX and DAX closed on Monday at the Point of Control, the volume profile analysis suggests there is room for further decline.
Now comes the educational content. This segment is exclusive for paid subscribers. Get access using the button below. New content is released every Wednesday. Topics covered so far include Bollinger Bands, Oscillators (6 indicators), Fibonacci retracements, Support & Resistance Levels, Confluence Zones, and there's more to come.
Master the VIX: Level Up Your Trading with This Volatility Guide
The VIX, or the Cboe Volatility Index, is a real-time market index that reflects investor expectations of volatility in the S&P 500 over the next 30 days. Here's a breakdown of what it is and how you can approach trading it:
Understanding the VIX:
Measures Volatility Expectations: A high VIX typically indicates investors anticipate large price swings in the S&P 500, suggesting market fear or uncertainty. Conversely, a low VIX suggests investors expect calmer markets.
Not a Direct Investment: The VIX itself isn't a stock you can buy or sell directly. Traders use derivatives like futures contracts, options contracts, and exchange-traded funds (ETFs) that track the VIX or its inverse movement.
Overall, the VIX can be a valuable tool for understanding market sentiment and potentially hedging portfolios or speculating on volatility. However, due to the complexity of VIX derivatives, it's crucial to approach them with extreme caution and a strong understanding of the risks involved. This document is providing context about VIX and is not advising about any investment related to the Volatility Index.
Generally: A VIX above 30 is typically considered high and suggests significant market fear or uncertainty.
Historically: The long-term average of the VIX is around 21. So, anything above that can be seen as a sign of increased volatility compared to historical norms.
Context Matters: Interpretation also depends on the context. For example, a VIX of 35 might seem less extreme if it occurs during a major economic crisis compared to a similar rise during a period of normal economic activity.
Here's a breakdown of how the VIX is generally viewed: