

Understanding the Sectors of the U.S. Economy: A Key to Analyzing the S&P 500
Understanding the Sectors of the U.S. Economy: A Key to Analyzing the S&P 500
Deciphering the Building Blocks of the Stock Market


The sectors are the building blocks of the SP500
The S&P 500, a widely followed benchmark index, is a reflection of the overall health of the U.S. economy. However, to truly grasp its movements and make informed investment decisions, it's essential to delve into the underlying sectors that comprise it. Each sector represents a distinct industry or group of industries, each with its own unique characteristics, trends, and sensitivities to economic factors. By understanding the dynamics of these sectors, investors can gain valuable insights into the potential drivers of the S&P 500's performance and make more strategic investment choices.
Each sector of the S&P 500 can provide specific signals based on economic conditions, market trends, and investor sentiment. Here’s an overview of the signals associated with each sector:
1. Communication Services (XLC): Often sensitive to changes in consumer behavior and advertising spending; signals can indicate trends in media consumption and technology advancements.
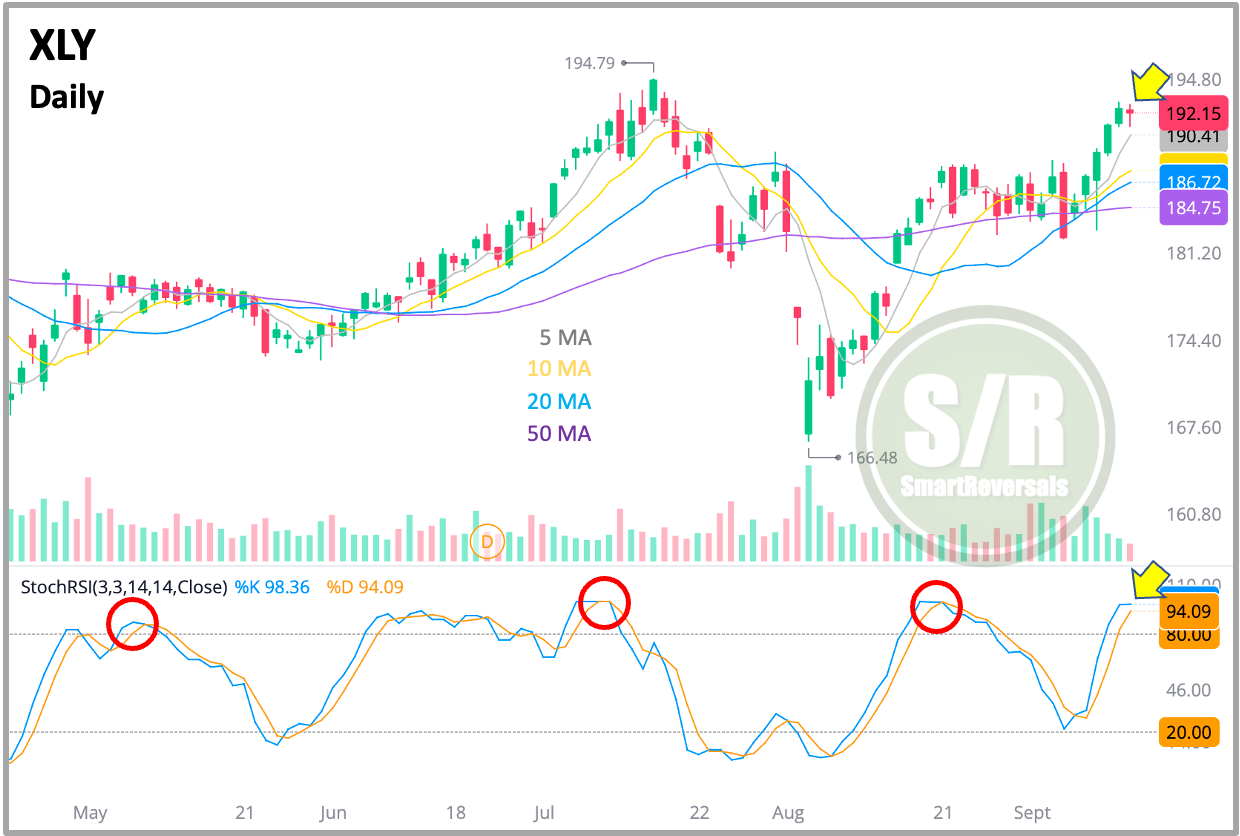
2. Consumer Discretionary (XLY): Signals consumer confidence and economic growth; strong performance typically suggests rising consumer spending and economic expansion.
This sector includes companies that produce non-essential goods and services (hence its name), such as automobiles, retail, and leisure. It's more cyclical than the Consumer Staples sector, as consumer spending on discretionary items can be influenced by economic conditions.
3. Consumer Staples (XLP): Often seen as a defensive sector during volatility; strong performance signals economic uncertainty, as consumers prioritize essential goods.
This sector consists of companies that produce essential goods and services, such as food, beverages, and household products. These companies tend to be relatively stable, as consumers typically continue to purchase these necessities regardless of economic fluctuations.
4. Energy (XLE): Signals trends in oil prices and energy demand; rising prices often indicate inflation concerns or supply constraints, while falling prices suggest economic slowdown.
This sector includes companies involved in oil and gas exploration, production, and refining. It's highly cyclical and subject to fluctuations in commodity prices.
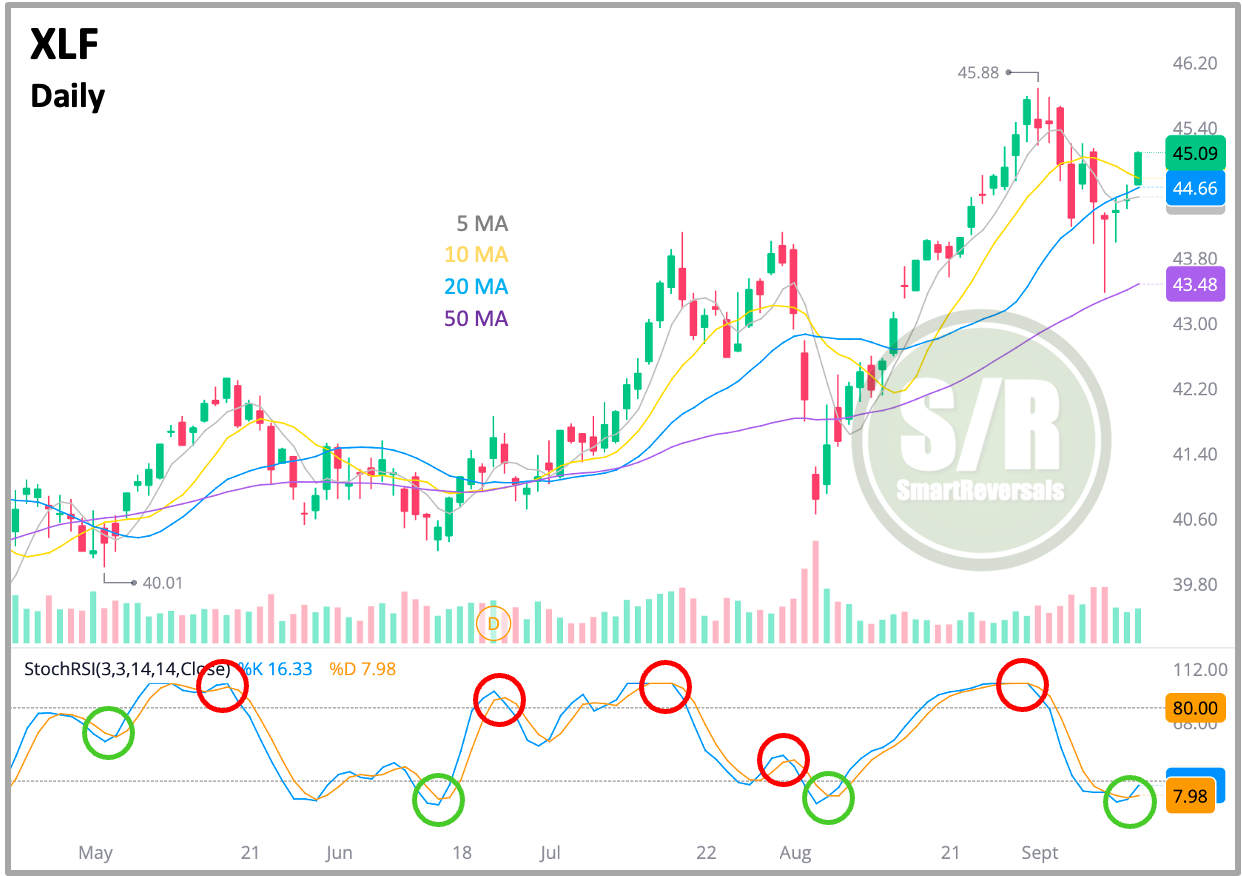
5. Financials (XLF): Often provides signals for interest rates; rising rates typically benefit banks and financial institutions, indicating economic growth, while falling rates can signal recessions.
This sector includes banks, insurance companies, and other financial institutions. It's highly sensitive to economic conditions, as the health of the financial sector can significantly impact overall market sentiment.
This sector has been on the radar during the recent editions of the Weekly Compass, two weeks ago a potential top was highlighted, and the recent bottom matches the 50 daily moving average (purple line), and the 10 weekly average (presented to paid subscribers last Saturday).
The oscillator is suggesting bullish continuation since the bullish crossover happened in oversold zone. $45.35 is the closest resistance zone, and depending on the reaction to interest rates, the next major resistance is located at $47.7.
6. Health Care (XLV): Signals demographic trends and healthcare spending; strong performance may indicate aging populations or increasing healthcare demands, independent of economic growth.
This sector comprises companies involved in pharmaceutical manufacturing, medical devices, and healthcare services. It's often seen as a defensive sector, as there is typically a consistent demand for healthcare products and services.
7. Industrials (XLI): Signals economic infrastructure and manufacturing strength; strong performance reflects robust economic growth, while weakness can indicate a slowdown in economic activity.
This sector includes companies involved in manufacturing, construction, and transportation. It's sensitive to economic cycles, as industrial activity tends to increase during periods of economic growth and decline during recessions.
8. Information Technology (XLK): Indicates innovation and technological adoption; strong performance often signifies investor confidence in future growth and advancements in technology.
This sector encompasses companies involved in software development, hardware manufacturing, and technology services. It's often considered a growth sector, driven by innovation and technological advancements.
9. Materials (XLB): Signals demand for raw materials; rising prices suggest a growing industrial sector, while falling prices may indicate reduced manufacturing activity.
This sector includes companies involved in mining, metals production, and construction materials. It's also cyclical and subject to fluctuations in commodity prices.
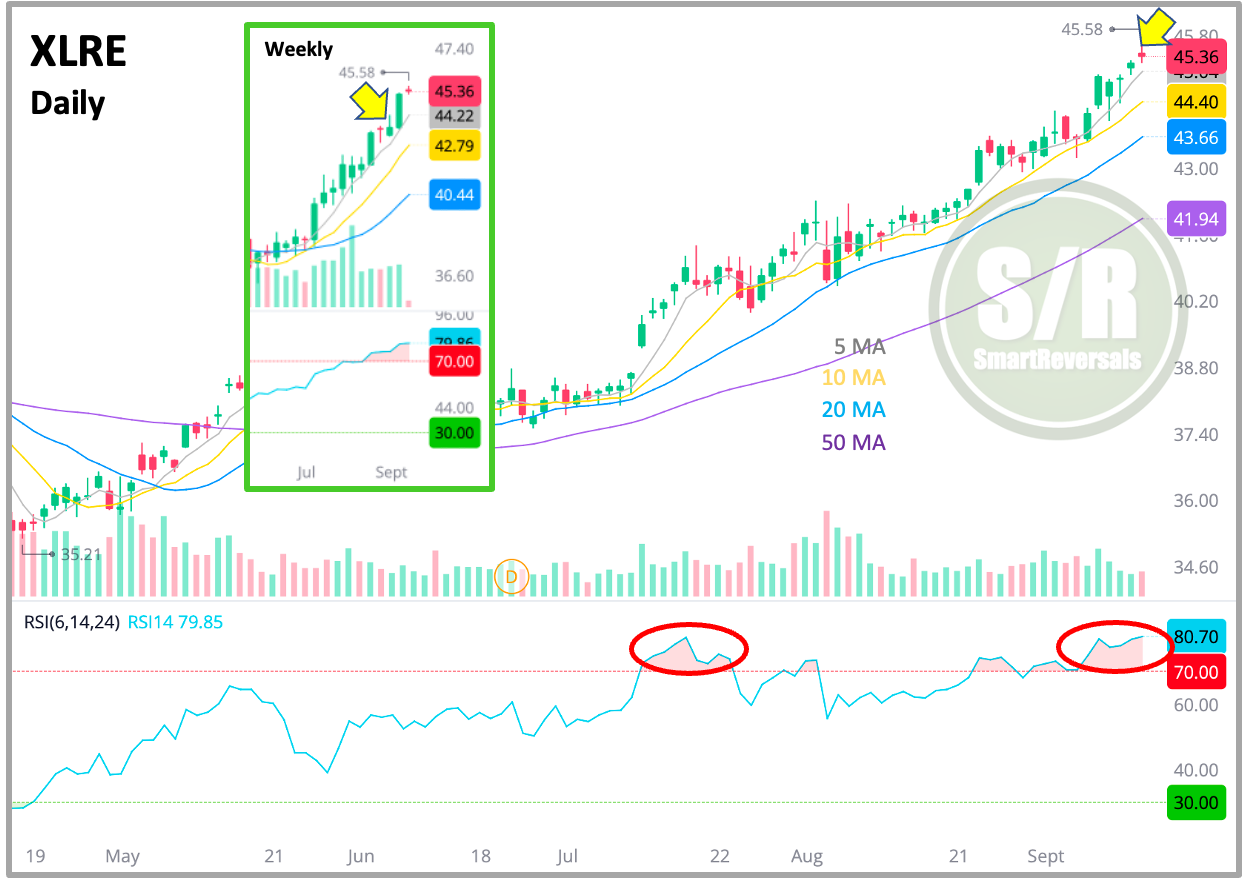
10. Real Estate (XLRE): Signals interest rates and housing demand; strong performance typically indicates low mortgage rates and robust housing markets, while weakness may reflect rising rates. This sector involves companies such as:
Real estate investment trusts (REITs): These companies own and operate income-producing real estate properties, such as office buildings, apartment complexes, retail spaces, and industrial facilities.
Real estate management companies: These companies manage real estate properties for owners, providing services like property management, leasing, and maintenance.
Real estate development companies: These companies develop and construct new real estate projects, such as residential and commercial buildings.
Real estate services companies: These companies offer a variety of services related to real estate, such as brokerage, appraisals, and title insurance.
This sector has been soaring, it’s worth noting how overbought it is in the daily and weekly timeframe, with a Relative Strength Index (RSI) above 70, which is the threshold to define overbought conditions and higher risks of a pullback.
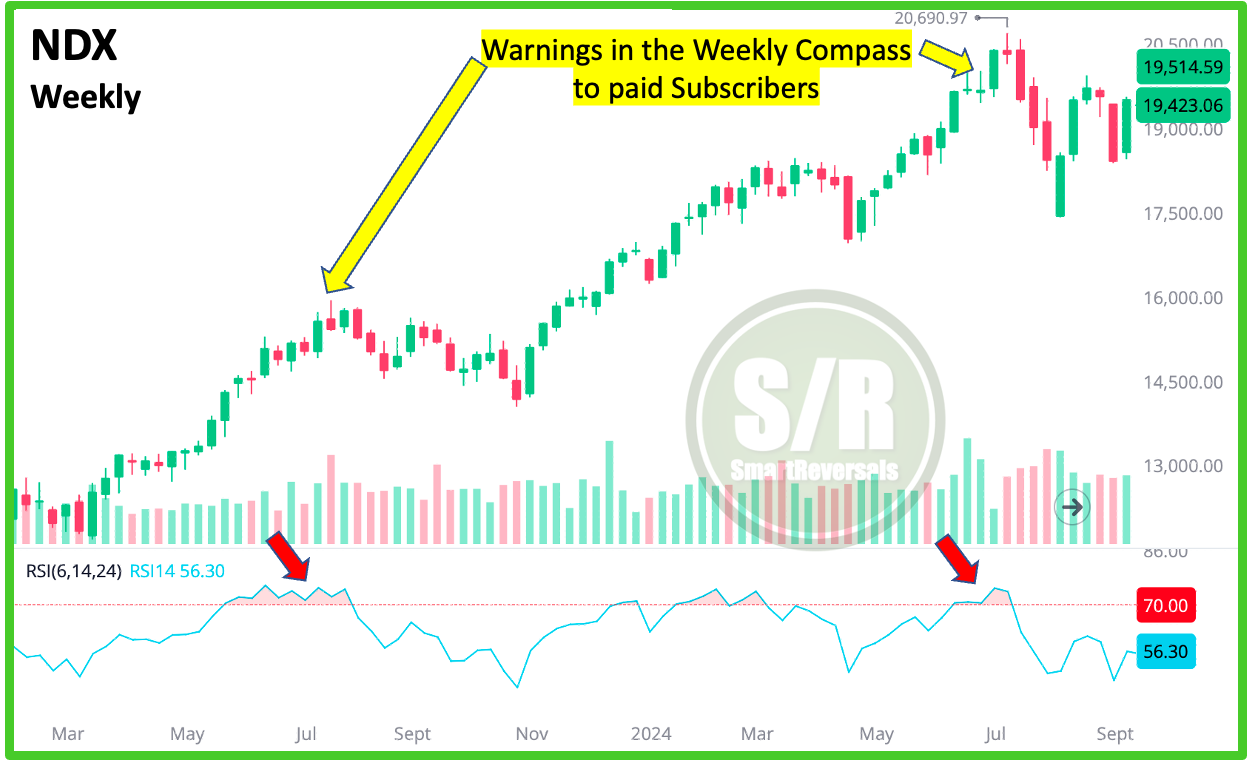
The candle from the second last week looked like a potential reversal candle, the sector continued its rally closing above the wick, temporarily invalidating the warning signal. Anyway be careful about a potential bull trap, remember that I warned the July top based on a comparable price action with overbought conditions; the week after SPX and NDX rallied attracting more FOMO buyers, and then they declined (the chart is below XLRE).
Observe two references of delayed tops in the chart for Nasdaq100, both cases were signaled in the Weekend edition considering price action (candles & Volume), RSI and other indicators, they looked invalidated for a week, but the chart and the subsequent declines speak by themselves.
That said, risk management is key, and the S/R levels are the best insurance to protect profits: $45.8 is a major resistance, don’t rule out more buying pressure until that point. On the support side, $44.6 can be used as a reference to protect gains.
A paid subscriber mentioned XLRE some days ago in a very kind and positive review, hence my extension in this sector.
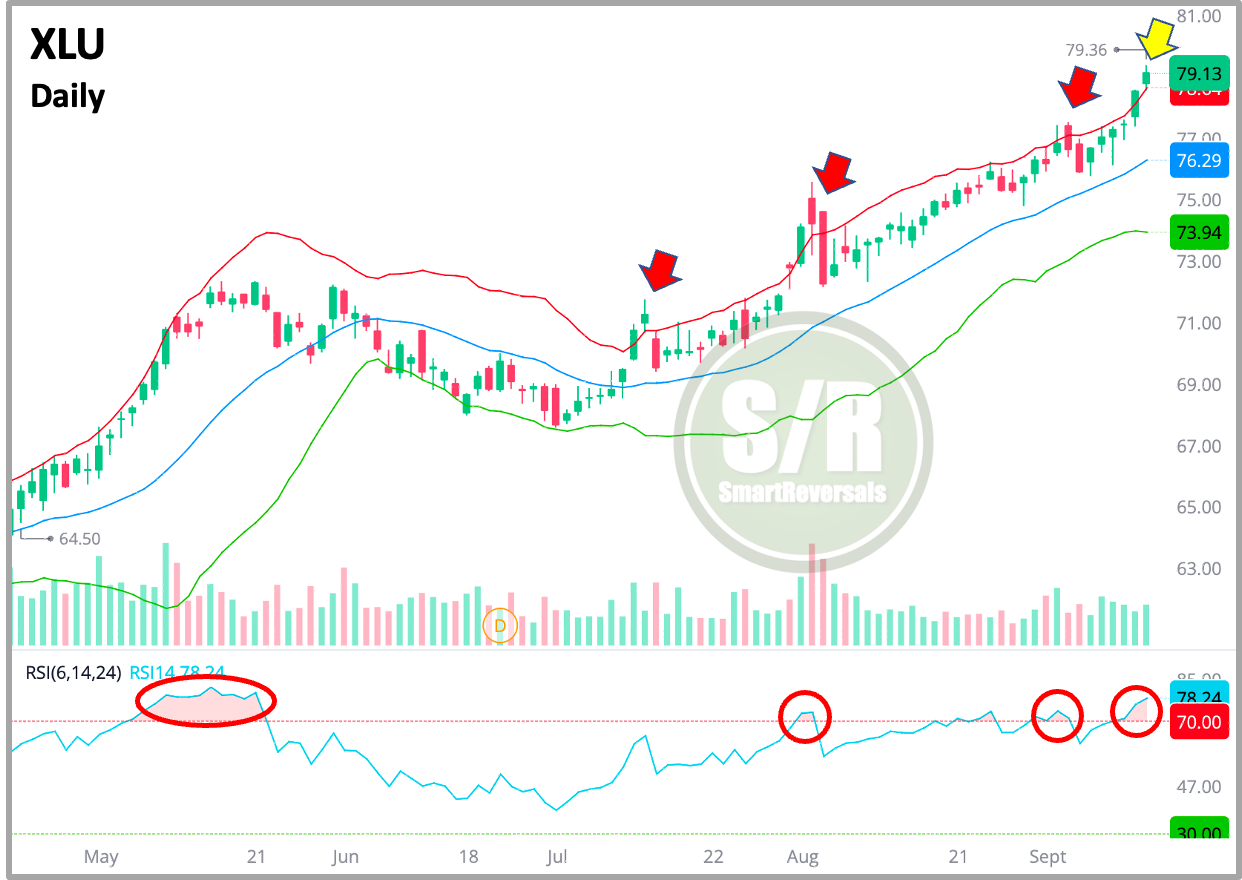
11. Utilities (XLU): Signals interest in defensive investments; strong performance indicates economic uncertainty, as investors seek stable returns, while underperformance can signal economic confidence.
This sector includes companies that provide essential services such as electricity, gas, and water. These companies tend to be relatively stable, as they are often regulated by governments.
Price action has jumped the higher Bollinger band with a potential evening star formation, and the RSI is overbought. See the previous occurrences when that band has been breached.
Utilities are useful to analyze interest rates, the correlation is not perfectly negative, but a potential jump in TNX is possible. That sounds odd ahead of a FOMC meeting where rates will be cut.
These signals help investors gauge market conditions and make informed decisions based on sector performance.
Now you have a better context and know how to use the sectors for your studies, when something is flagged by a sector, that is included in the Weekly Compass.
Some people have asked me about what is included in a Weekly Compass
This edition, featuring just five charts, offers a taste of the comprehensive Weekly Compass, which includes more than 20 charts every Saturday. Additionally, the educational content published every Wednesday provides in-depth explanations of technical and fundamental indicators, using real-world examples from SPX, NDX, NVDA, TSLA, AAPL, and other popular securities. The friendly approach makes learning more engaging than dense textbooks filled with outdated examples like MSFT in 2006 or CSCO in 2000.
One of the highlights of the Wednesday editions are the special studies. They have recently explored three compelling topics:
Price Action: Four publications delving into candles, volume, Level 2, and volume profile.
Market Breadth: Three publications analyzing the divergence that foreshadowed the July peak.
Rate Cuts and Moves in SPX and Bonds: Three must-read editions for understanding current market dynamics.
If you’re paid subscriber you can go straight to the Level Up Your Trading section here:
https://smartreversals.substack.com/s/level-up-your-trading
This Wednesday, we'll delve into two specific indicators before continuing with a series on fundamental analysis for key companies.
Now that you have a better understanding of sectors, let's explore some of the leading companies in each one:
Largest Stocks in Each Sector (as of September 2024)
These are the largest companies within each sector based on market capitalization. Rankings can change over time due to market fluctuations and company performance.
Communication Services
Alphabet (GOOG)
Meta Platforms (META)
Verizon Communications (VZ)
AT&T (T)
Comcast (CMCSA)
Consumer Discretionary
Amazon (AMZN)
Tesla (TSLA)
Home Depot (HD)
Nike (NKE)
Walt Disney (DIS)
Consumer Staples
Procter & Gamble (PG)
Coca-Cola (KO)
PepsiCo (PEP)
Johnson & Johnson (JNJ)
Walmart (WMT)
Energy
ExxonMobil (XOM)
Chevron (CVX)
Schlumberger (SLB)
Halliburton (HAL)
Occidental Petroleum (OXY)
Financials
JPMorgan Chase (JPM)
Bank of America (BAC)
UnitedHealth Group (UNH)
Berkshire Hathaway (BRK.B)
Charles Schwab (SCHW)
Healthcare
UnitedHealth Group (UNH)
Johnson & Johnson (JNJ)
Abbott Laboratories (ABT)
Merck & Co. (MRK)
Pfizer (PFE)
Industrials
Honeywell International (HON)
3M (MMM)
Caterpillar (CAT)
United Parcel Service (UPS)
Boeing (BA)
Information Technology
Apple (AAPL)
Microsoft (MSFT)
Nvidia (NVDA)
Alphabet (GOOG)
Amazon (AMZN)
Materials
Linde (LIN)
Dow Inc. (DOW)
DuPont de Nemours (DD)
3M (MMM)
Alcoa (AA)
Real State
Brookfield Asset Management (BAM)
American Tower Corporation (AMT)
Digital Realty Trust (DLR)
Crown Castle International Corp. (CCI)
Welltower Inc. (WELL)
Utilities
Duke Energy (DUK)
NextEra Energy (NEE)
Southern Company (SO)
Consolidated Edison (ED)
American Electric Power (AEP)
Now you have a complete context of the eleven sectors of the U.S. economy and some acronyms that you can use to find them in your charting or trading system!
Your likes or reposts to this publication are as important as the ones on social media.
This market research and educational content is not intended to be investment advice.
👌