

The Market Roared With the FED - Divergences Suggest Caution
The Market Roared With the FED - Divergences Suggest Caution
Gigantic volume on Friday in a session with little move in price is also something to watch.


Is this the pathway to a sustainable bright horizon for the stock market? Numerous signals suggest caution
Last week, the Weekly Compass anticipated bounces in OIL, bullish continuation for all U.S. indexes, DAX, Bitcoin; and the setups for tech anticipated bullish continuation.
GDX reached exactly $41 and retraced, TSLA finally broke out the resistance line on watch and stocks like GOOG, AAPL, META, and AMZN conquered significant annual levels. NVDA continues weak as MSFT.
My vision of a bullish move is documented since the very bottom of the crash starting in August, including bullish signals after a hiccup in the first week of September in the McClellan oscillator and price action on NDX at the volume shelf that were proven true with a rapid rebound and had continuation this week that just ended.
The FED cut rates 50bps, that injects a lot of energy in the near term to the market, but what is worth watching is the continuation after a couple of days.
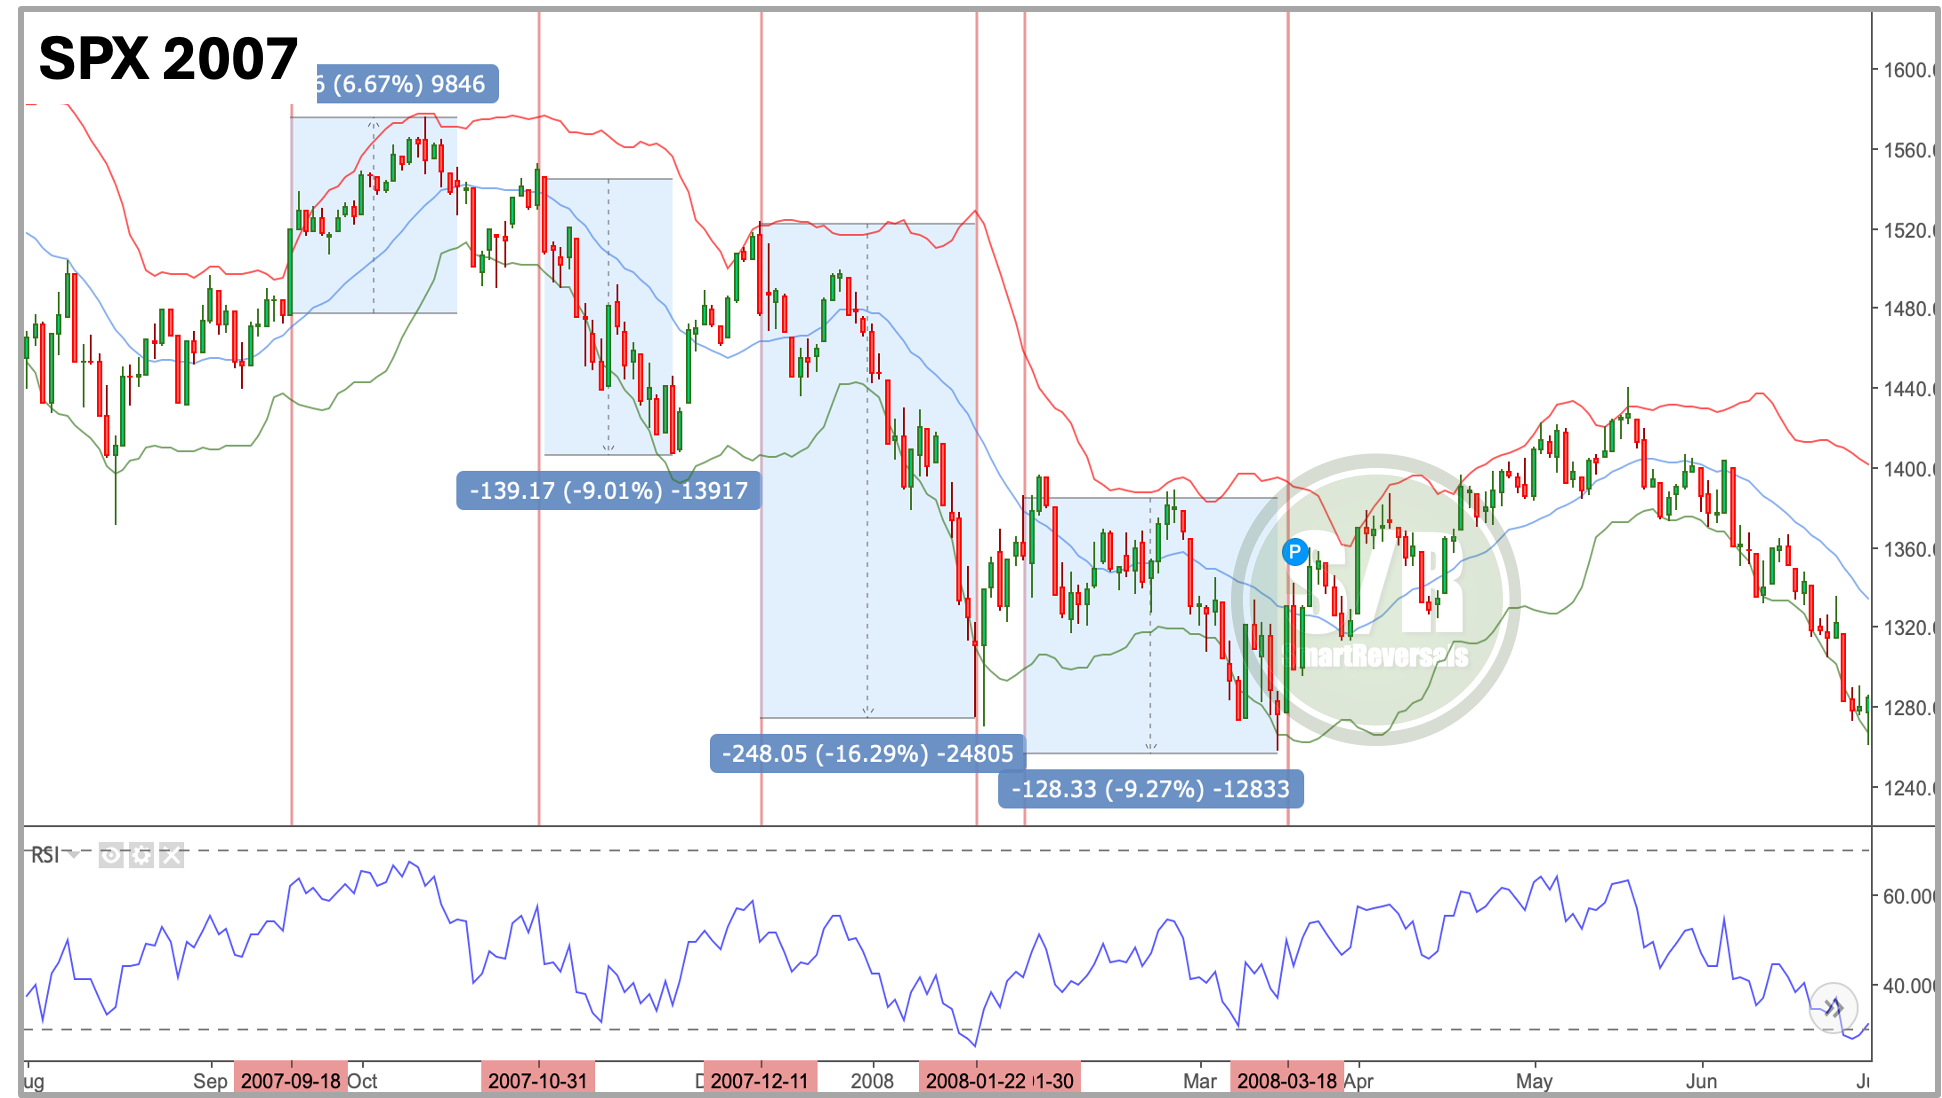
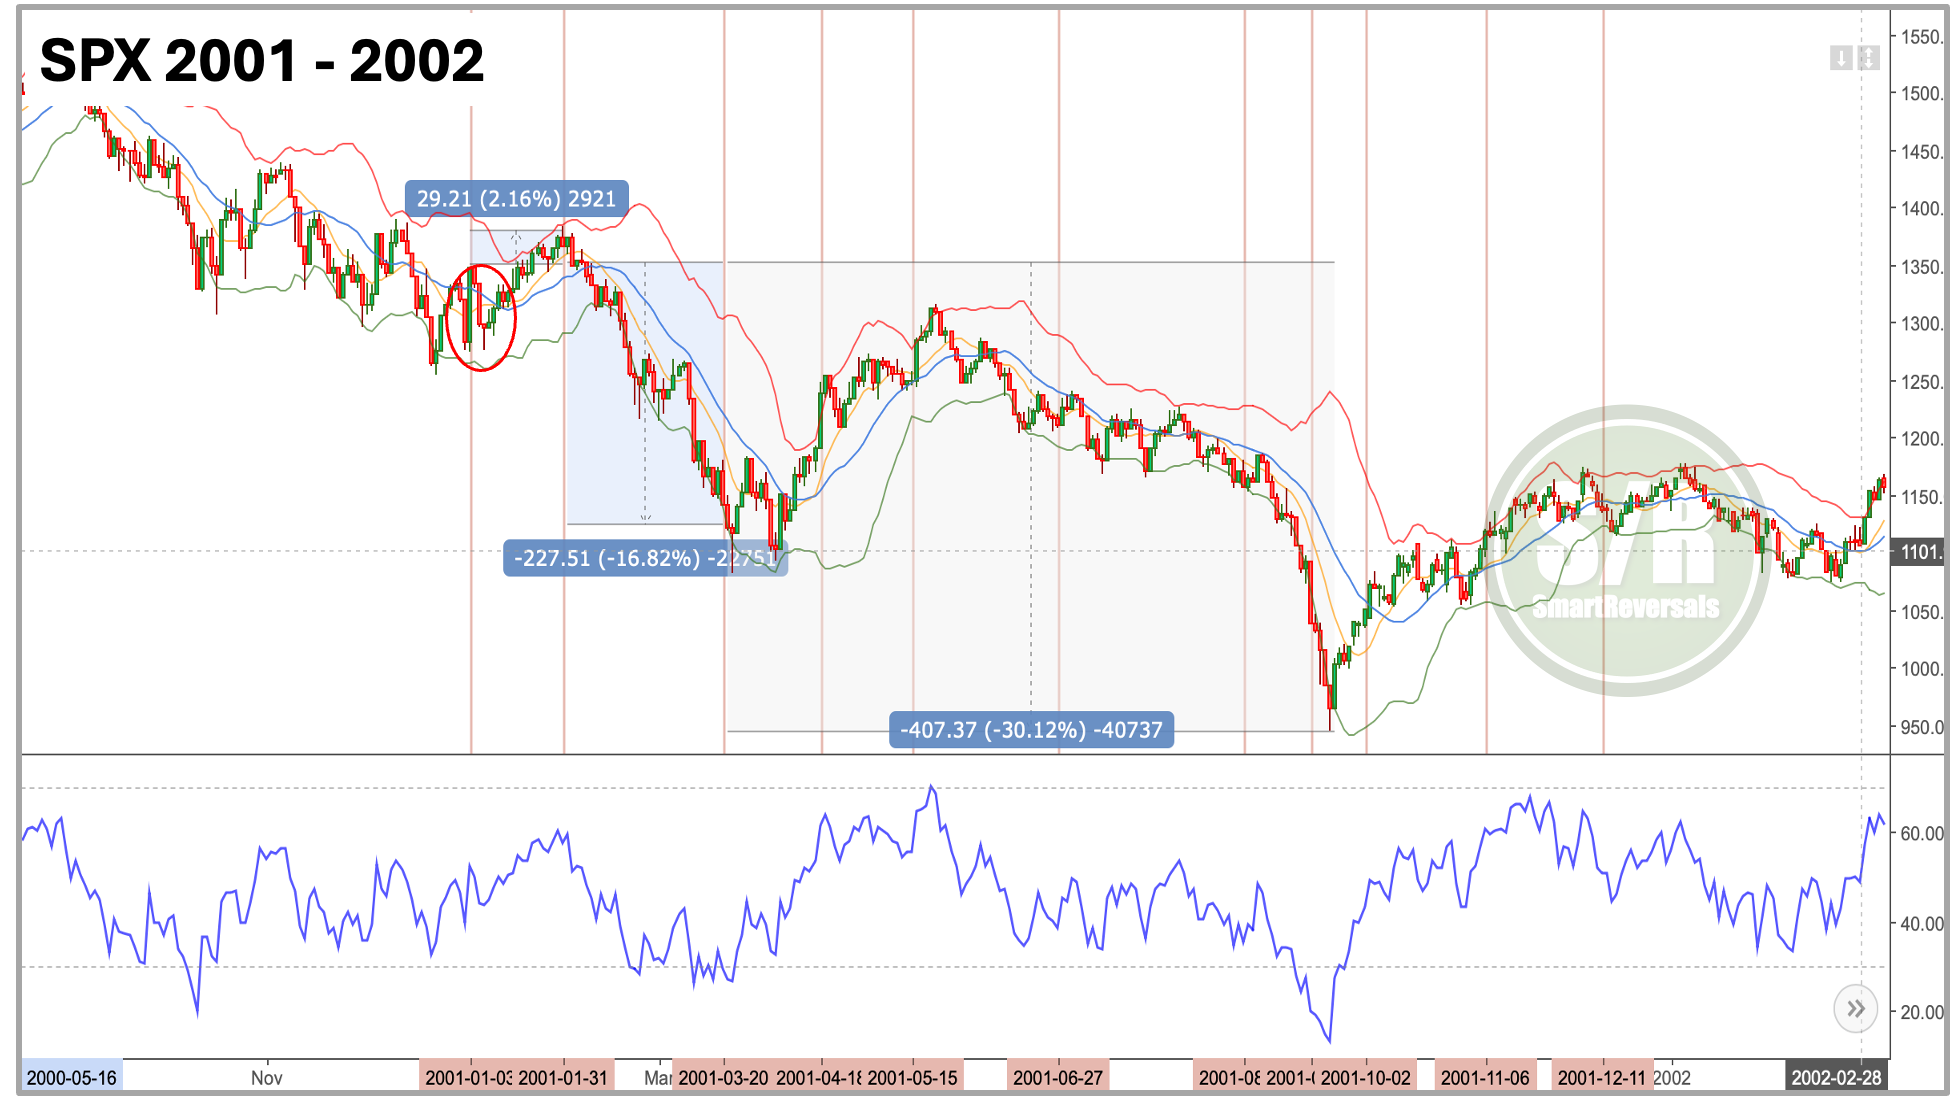
The next two charts present the moves after the first rate cut in 2007 and 2001, this is a reminder of the extensive study of rate hikes published two weeks ago.
In September of 2007 the initial reaction was explosive, a 6% jump in SPX that after three weeks vanished. In January 2001 there was also a bullish reaction after a jumbo rate cut of 50 bps, and you can tell the subsequent move in the second chart.
SPX Daily Charts:
For more details use the following links, this is a series of three installments that are still a must read, an educated investor or trader plans ahead and is prepared, a reactive investor or trader may lose opportunities or capital:


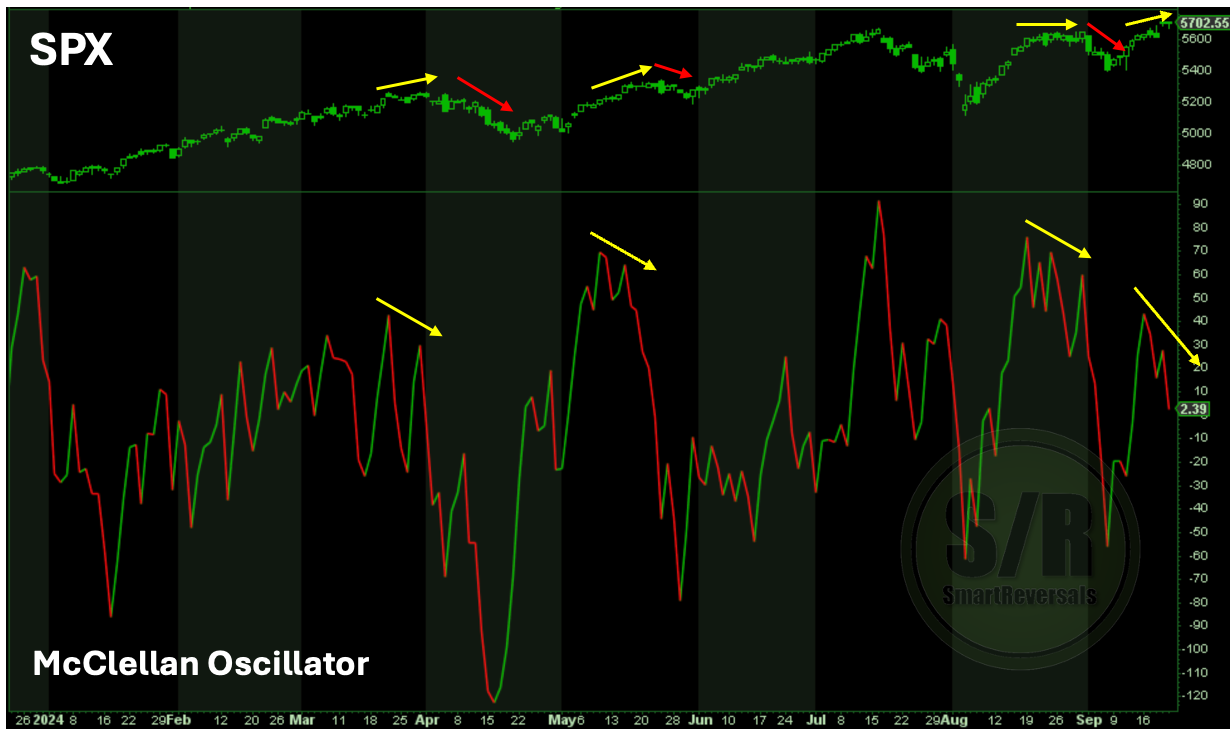
McClellan Oscillator
The market is presenting a divergence, SPX roared during the last few days, but the McClellan oscillator is declining, the chart highlights how this pattern has preceded declines that look small in the upper chart, but if you were trading in July 2023, you may remember that SPX suffered a correction during the third quarter of that year.
The zero zone where the index is today may present some support, but that is not a rule and price action suggests caution.
So far my studies about breadth signals, technical analysis and historical charts before and after rate cuts have anticipated the recent All-Time-Highs, today I’m more cautious considering several divergences like this one and the recent gigantic volume in muted sessions after a rally.
Other divergences and cautionary signals that must be on watch are studied today, the first one is in the SPX itself. There are more than five additional warning signals that are studied next. Paid subscribers know the seriousness of my publications, I raised documented warnings in July before the top in tech and the subsequent correction.
SPX