The Expected Bounce Happened - What's Next for the Market After the FED Decision?
In-Depth Analysis of Key Technical Indicators and Levels for a Volatile Week Discover detailed insights from 25+ charts, including SPX, QQQ, NVDA, TSLA, Bitcoin, OIL, IWM, DXY, and more.
What’s coming after the rate cuts? - An abyss? or a bullish context?
As presented in previous editions, probabilities after breadth signals and historical studies about rate cuts periods suggest new all time highs are coming, and technicals presented last week like Volume Shelves and the McClellan Oscillator suggested that a bounce was around the corner.
SPX and NDX bounced from a higher level than expected, Dow Jones and Small Caps (IWM) were the ones reaching the first weekly support and they bounced rapidly on Wednesday. Technical analysis is about probabilities and the S/R Levels are the rapid validators, so once $5,478 and $18,753 were conquered for SPX and NDX respectively (levels provided in advance on Fridays), the indexes soared.
Tech closed last week on the edge of a cliff, and as mentioned, that sector and most of the Mag 7 were suggesting a bounce was in play, that’s why the central weekly level was mentioned in the context of every chart. Once that level was consolidated on Wednesday, long entries could have been considered based on each one’s investment style.
The financial sector was presented two weeks as a warning for a pullback, it happened, the considerations about what’s next are updated today.
Bitcoin is moving from annual S/R level to the other, those lines have been published since March in this publication, back then they looked like one more line as many traders devise, today they look like the staff where a symphony is written; that is why my approach draws lines in advance, not in retrospective.
JPY & NDX
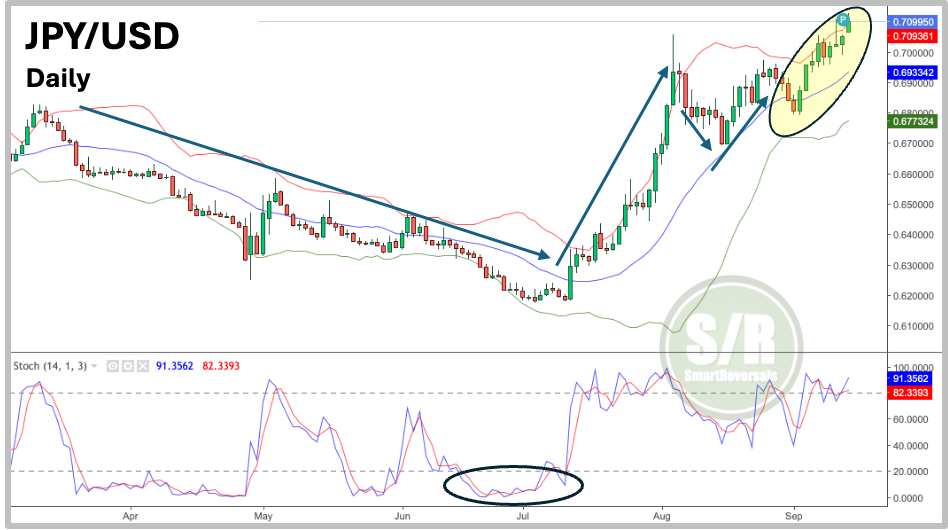
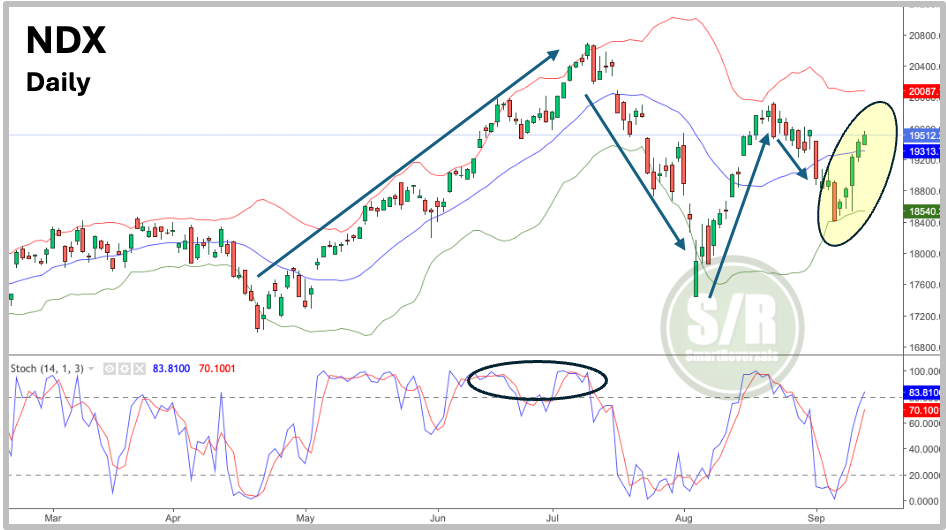
The Japanese currency has presented an inverse correlation with Nasdaq, and it makes sense considering the carry trade. What is interesting today is that the inverse moves are temporarily divorced, last week the JPY moved up like NDX.
This is definitely something to watch carefully as a macro indicator, even more considering that the BOJ is anticipating rate hikes that could generate a domino effect when borrowing Yens to invest in the US Market is not as cheap as before.
See the inverse position in oscillators and Bollinger bands, today both are pointing in the same direction, who is telling the truth?
CARRY TRADE
The carry trade is a popular investment strategy where investors borrow funds in a low-interest rate currency (like the Japanese yen) and invest them in a higher-yielding currency or asset. The difference in interest rates is the profit potential.
Here's how a rate hike in Japan would affect this strategy:
Increased Borrowing Costs: When Japan raises interest rates, the cost of borrowing yen increases. This reduces the profit margin for the carry trade.
Strengthening Yen: Higher interest rates in Japan can attract more foreign investors, leading to a stronger yen. This can reduce the value of the other currency or asset in the carry trade, potentially eroding profits or even leading to losses.
Forced Liquidations: As the yen strengthens, investors may be forced to unwind their carry trade positions to repay their loans before the value of their investments declines further. This can lead to a sell-off in the higher-yielding assets, causing market volatility.
U.S. MACRO NOTES: 25 or 50 BPS?
Inflation data from the past week revealed a significant easing of price pressures since their peak in 2021-2022. As the Federal Reserve prepares for its two-day policy meeting on Tuesday, they are closer to their goal of achieving low inflation. However, the extent to which they will lower interest rates remains uncertain.
While these readings pave the way for an interest rate cut at the Federal Open Market Committee meeting, the degree of aggressiveness remains a question. Financial markets, often a barometer of the Fed's direction, have been inconclusive.
For much of the past week, futures markets were leaning towards a quarter-point interest rate cut. However, on Friday, sentiment shifted towards an almost equal likelihood of either a 25 or 50 basis point reduction, according to the CME Group's FedWatch tool.
TECHNICAL DIVE
In this edition you will see the importance of volume at price. Last week's bearish candles encountered resistance in volume shelves and at S/R levels, including the annual ones, which are consistently featured in the Weekly Compass.
In May and June, I wrote a series of publications covering price action, it included candlesticks, daily/weekly volume, Level 2, and volume at price, you can visit the educational content about the last one here:
IMPORTANT NOTE ABOUT S/R LEVELS
Next week may bring high volatility as the one seen the previous one after CPI. The rate decision can shake the markets, read again the series of Rate Cuts published recently, the risk management has to consider each one’s objectives, personality and openness to what is coming.
Today’s Weekly Compass highlights the key central level to watch for each security, the one that makes the difference between bull and bear, some people may want to lock some profits, others ay prefer wait and see key levels defended, other people may give more oxygen to any long trade based on the first weekly support level instead of the central weekly one, and others could use the first resistance level as insurance if the bias is to short. The S/R levels provided every Friday have as much about psychology as technical, hence the price variation that each of them represents.
This Weekly Compass includes charts and analyses for SPX, NDX, DJI, IWM, DAX, Nikkei, Bitcoin, GDX, Oil, NVDA, AAPL, TSLA, GOOG, META, AMZN, MSFT and other five contextual charts that have proven useful to anticipate market moves. Let’s begin:
SPX
The weekly candle's formation closely resembles the patterns that have historically preceded bullish rallies, as illustrated in the chart. While I anticipated further declines on Monday before a rebound, the market actually bounced due to oversold breadth as indicated by the McClellan Oscillator. Price remained in consolidation on Tuesday, and the anticipated additional dip occurred on Wednesday, followed by the expected bounce.
Beyond the weekly levels, the 20-week moving average provided robust support, reinforced by its confluence with the lower edge of volume shelf “A”. This expanding shelf is likely to offer support during any short-term volatility related to interest rate cuts. Additionally, the annual support level indicated in the chart proved effective in bolstering prices.
The Federal Reserve's decision will significantly influence the magnitude of the subsequent move. A 50 basis point rate cut would likely be extremely bearish, as historical precedent suggests. Even with a temporary post-news rally, a 25 basis point cut is currently more anticipated and could lead to a market development similar to 2019.
The next potential target for this bullish move, and the key level to hold for the bullish case are as follows:


