

Second Week of Bullish Reaction After Rate Cuts, Still Nothing Different From Previous Occurrences
Second Week of Bullish Reaction After Rate Cuts, Still Nothing Different From Previous Occurrences
After reaching new All Time Highs as expected, and making fun of the seasonality approach, SPX is showing exhaustion, see the key indicators.


The bullish move in the market after the first rate cut is following the same script of 2007 and 2001, it’s still soon to declare the bull market will continue intact. October is coming with a bouncy VIX and mixed signals.
From the previous edition, NDX and most of the seven tech giants confirmed the bullish setups described, SPX continues on its path to a bullish target shared two weeks ago, the 10 year note continue the bounce move, and also Bitcoin, both also as expected.
Last week, a surge in market breadth fueled the rally for another week. This pattern echoes the rallies of 2007 and 2001, as seen in the charts shared last weekend. Back then, there was a three-week rally between the September 2007 rate cut and the October peak.
Very interesting breakouts happened also in international indexes, Nikkei and Dax roared there are key technical elements to consider in both charts, also in GDX.
Why the rate cuts in 2001 and 2007 were followed by bear markets?
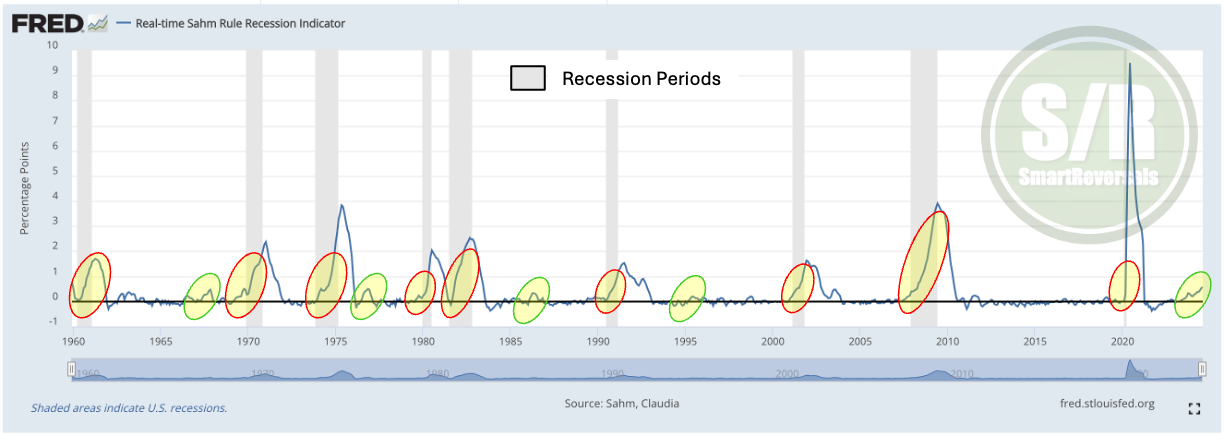
Recessions came up in both events, and that is the main trigger for a crash. There are different indicators that provide recessionary signs, the Sahm Rule is one of the strongest.
The Sahm Rule:
It is a simple but effective indicator for anticipating recessions. It was developed by economist Claudia Sahm and is based on the premise that a significant increase in the unemployment rate is a strong signal of an impending recession. It works this way:
Calculate the three-month moving average of the unemployment rate. This involves averaging the unemployment rates for the current month and the two previous months.
Compare this average to the lowest three-month moving average unemployment rate over the past 12 months.
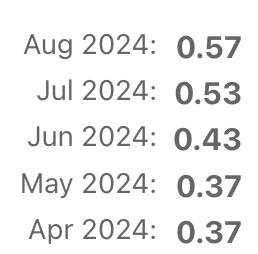
If the current three-month average is 0.50 percentage points or more higher than the lowest three-month average over the past 12 months, a recession is likely underway.
The current reading for August is 0.57, and July was also above 0.5:
Key points to consider:
The Sahm Rule is a leading indicator, meaning it signals a recession before it is officially declared by the National Bureau of Economic Research (NBER).
The Sahm Rule has been shown to be a reliable indicator of recessions in the past, but it is not foolproof, hence the red (bearish) and green highlights in the chart.
This indicator jumped in 2001 and 2007, as it is doing so today.
It is important to consider other economic indicators in addition to the Sahm Rule when assessing the likelihood of a recession, they were studied in a comprehensive way in this educational content:

Today’s edition of the Weekly Compass brings two special contents:
A study of bear markets since 1987, there is a pattern, and if you are an active participant in the stock market you must know it. Numbers and metrics are clear, this is zero opinion-based.
Extended notes for Gold and Oil, considering how they behave in recessions and the potential implications of the moves indicated by the updated charts.
And as usual, the technical analyses for SPX, NDX, IWM, DJI, TLT, NVDA, META, TSLA, GOOG, AMZN, MSFT, AAPL, GDX, OIL, DAX, NIKKEI, BITCOIN and the contextual charts and indicators that is included in every premium publication.