

Nasdaq McClellan Oscillator, SMH and Macro-Indicators
Nasdaq McClellan Oscillator, SMH and Macro-Indicators
Key charts to start the week

Thank you for your continued support and feedback! You’re receiving this email as a note of appreciation or because you have been referred by a good friend or family member who knows you’re a stock market enthusiast.
Or of course, you’re part of the premium paid plan so you have access to every publication.
With an MBA and seven years of experience as Chief Investment Officer, I'm now focused on other ventures while managing my own portfolio. With the help of God, the good hard work example from my mother, and discipline I made it to senior positions very young. I started posting charts in social media in February 2023 trying to help retail traders who were then exposed to perma-bear noise and were missing great opportunities; in March 2024 I started my publication in Substack (a safe platform for writers and readers) and today more than 2000 readers receive my analyses.
I offer unbiased technical analysis and research to help traders navigate the market. My primary focus is on swing trading and position trading. I specialize in identifying trends, following price action, and raising necessary flags to take decisions.
Enough introductions, I’ll tell you more about me later. Let's get to the point. Today's free publication of the Trading Compass features three key topics:
Market breadth for Nasdaq100, the index that is dragging the market
Macro notes about Inverted Yield Curve
Support and Resistance Levels for SMH, the semi-conductors sector ETF.
Welcome to a free edition of the Weekly Compass

The market is back in turbulent waters
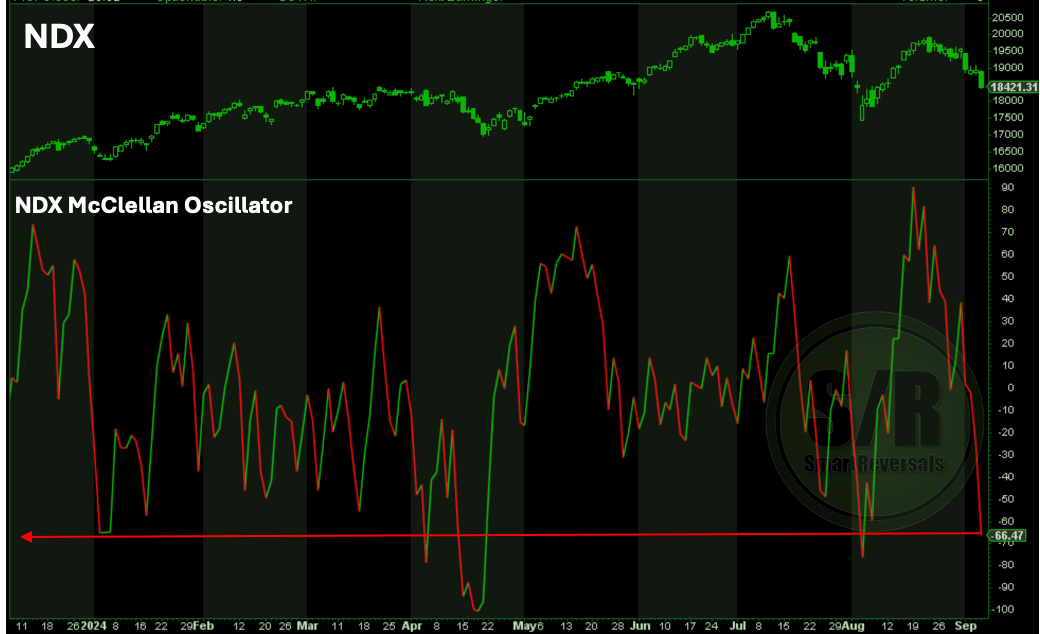
Nasdaq McClellan Oscillator (Market Breadth or Stock Participation)
The McClellan Oscillator is a popular market breadth indicator used to measure the overall strength or weakness of a market index, such as the Nasdaq100. It is derived from the difference between the number of advancing and declining issues on the index.
It is a market breadth indicator, focusing on the number of stocks moving up or down, rather than just the overall price of the index.
Currently, the index is nearing 70, a metric that is considered oversold, and as a reference, the bounce in early August in the market was at that point, no mention the reading in April that also warned about an imminent bounce.
According to this indicator, a technical bounce is near for tech.
Macro Information
The US yield curve has recently dis-inverted after a prolonged inversion, signaling a potential macroeconomic shift. Historically, the yield curve slope is a reliable predictor of recessions:
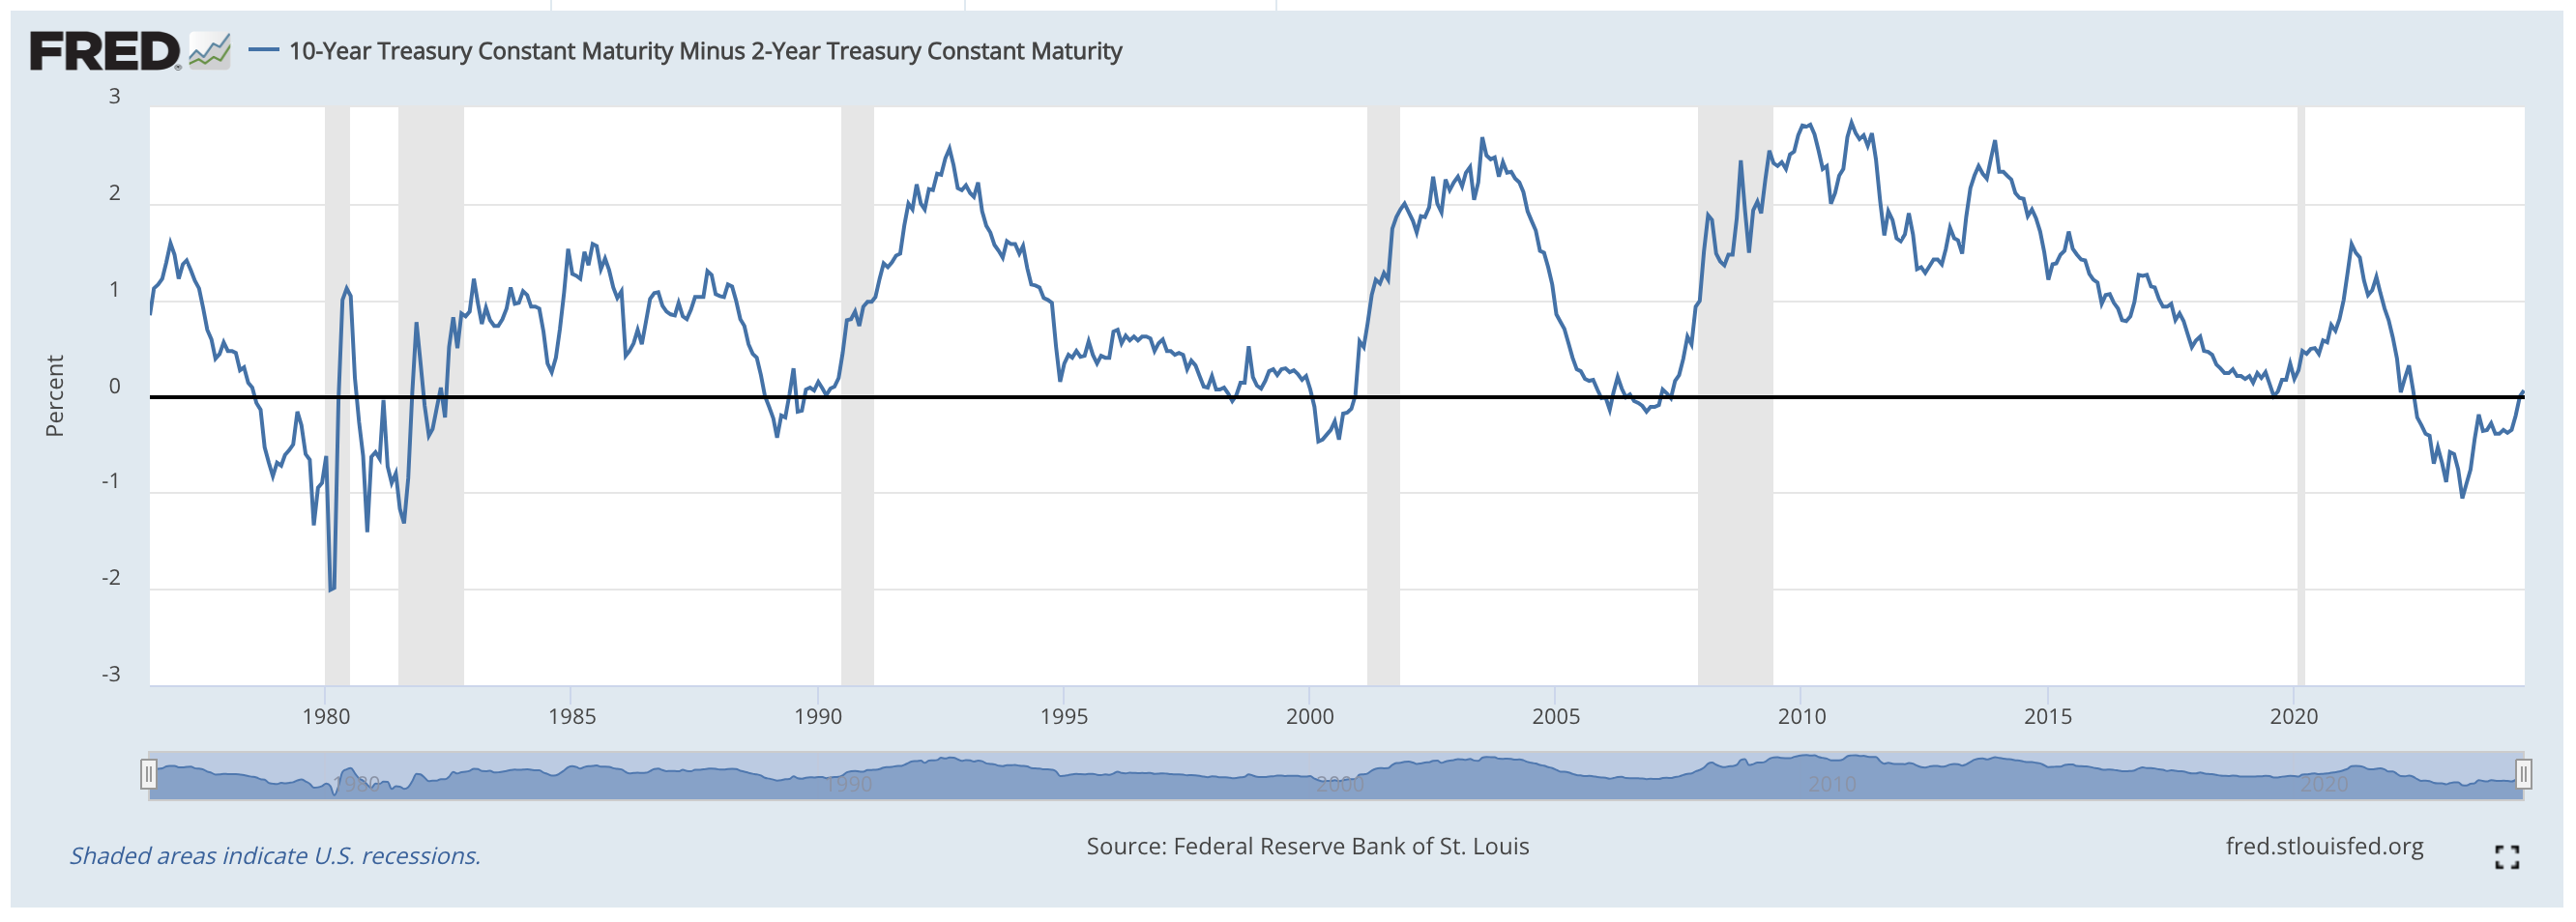
- An inverted yield curve typically indicates a recession, as it tightens credit conditions (high short-term yields) and reflects weak growth and inflation expectations (low long-term yields).
- A steep yield curve suggests lower borrowing costs (low short-term yields) and anticipates stronger growth and inflation (high long-term yields).
Currently, the yield curve is transitioning from a long period of inversion to a rapid dis-inversion, a crucial macro signal indicating weak growth ahead. Key historical patterns include:
1) Every recession since the 1970s has followed a yield curve dis-inversion.
2) The time between initial inversion and recession onset varies: as little as 12 months in the early 80s and 2000s, but up to 27 months in 2008.
3) Following dis-inversion, macroeconomic slowdowns typically occur soon after.
Today, the yield curve is now dis-inverting as the job market shows signs of slowing. The macro lags are long in this cycle, primarily due to fixed-rate mortgages and corporate borrowing cushioning the private sector from higher rates. However, the macro lags are still in play and have not yet dissipated.

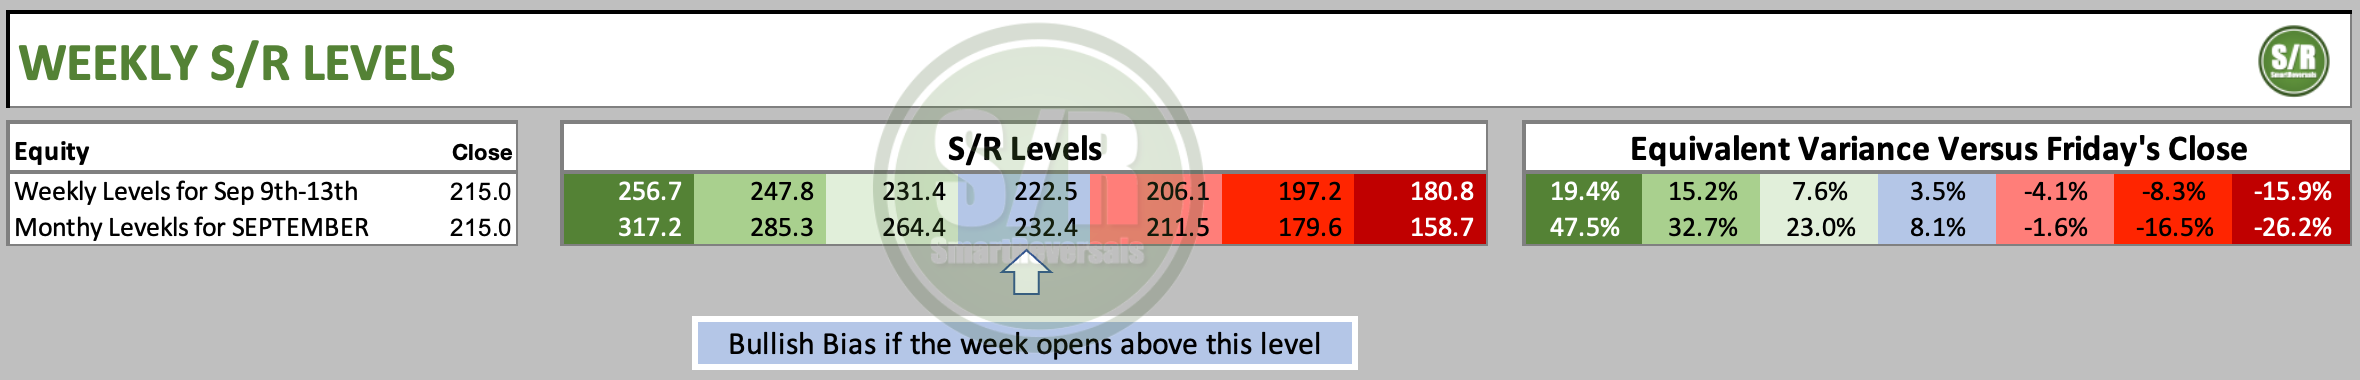
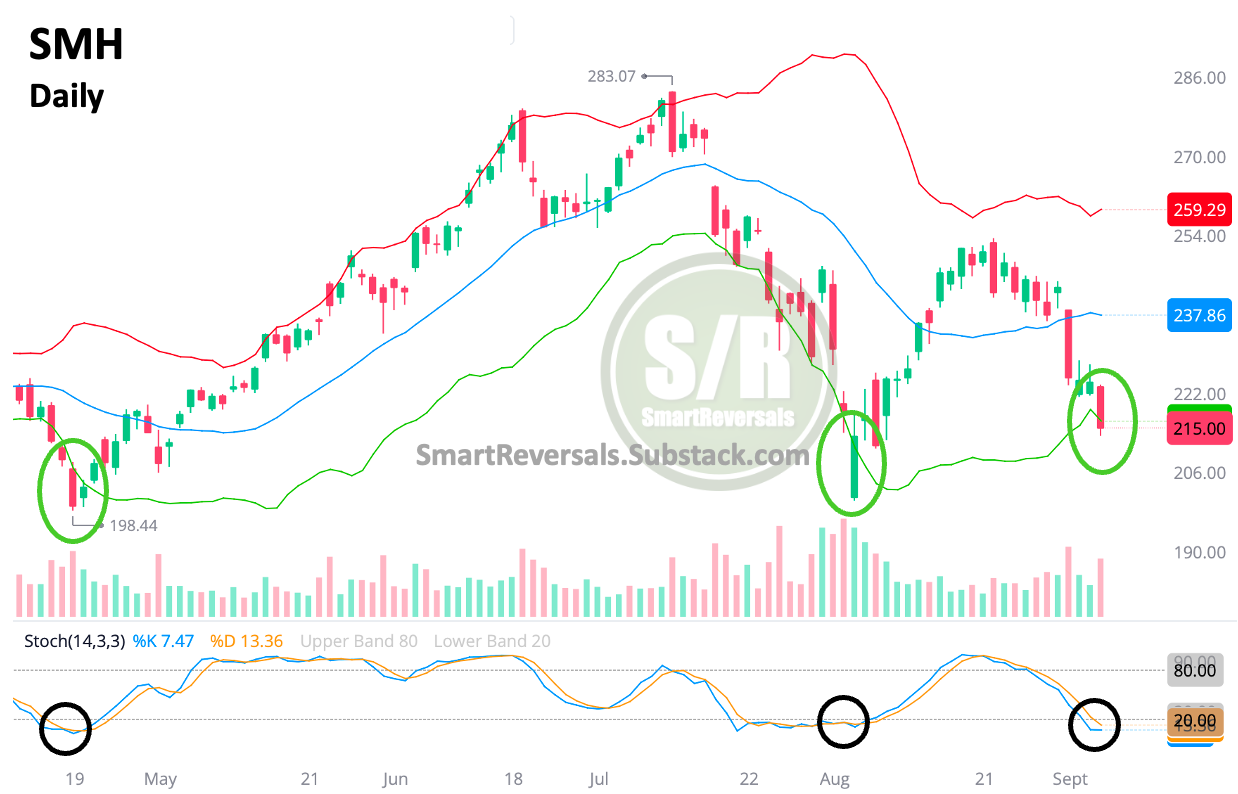
Support and Resistance Levels for SMH
Support and resistance levels are horizontal lines drawn on a price chart to identify areas where a market's price is likely to find support or resistance.
These levels are based on the idea that at certain price points, there's a concentration of buyers (support) or sellers (resistance) that can prevent the price from moving further in a particular direction.
Support Level: This is a price level where buyers tend to be more active than sellers. When the price reaches this level, it often finds support and bounces back up.
Resistance Level: This is a price level where sellers tend to be more active than buyers. When the price reaches this level, it often encounters resistance and falls back down.
How to Identify Support and Resistance Levels:
Look for horizontal lines: These lines often form at previous highs and lows on the chart.
Consider psychological levels: Round numbers (e.g., 100, 200, 500) can act as psychological support or resistance levels.
Use technical indicators: Moving averages, Fibonacci retracements, and other technical indicators can help identify potential support and resistance levels.
Key Points to Remember:
Support and resistance levels are not guarantees, but they can provide valuable insights into potential price movements.
Levels can change over time as market conditions evolve.
A break of a support or resistance level can signal a significant shift in the market's trend.
My approach of Support and Resistance levels have proven to be crucial for the indexes and stocks, SMH is not part of the premium plan, so I’ll be happy to give an added value to my premium subscribers and to you, as a new member of the community.
During this week, I’ll provide updates of price action relative to these levels, any bounce has to surpass $222.5 in SMH to consider it reliable, otherwise this security could be following a downtrend with technical bounces to the 5DMA, and then continuation sliding the Bollinger Band.
Draw the following lines in your charts, and let’s catch up; $179.6 should act as a bouncer if visited, and $222.5 is the key resistance to conquer.
Thanks a lot, have a good one.
For more information:
I write every Wednesday a publication in my site named Level Up Your Trading, presenting fresh examples of technical indicators and studies that I do when something abnormal or substantial is happening in the market.
https://smartreversals.substack.com/s/level-up-your-trading
MARKET BREADTH
There is a series of publications oriented to market breadth indicators, the last installment was published in July, and it was warning about a top in the market. If you upgrade your subscription you can learn more about McClellan oscillator, A/D Decline Line, McClellan Summation Index and others very useful. This is the link:

MACRO-ECONOMIC INDICATORS
During the last month, the most recent trilogy of publications was oriented to study the moves in SPX and TLT before and after rate cuts, the last installment concludes the key macro indicators that must be watched during these times.

SUPPORT AND RESISTANCE LEVELS
Every Friday, I provide to paid subscribers the S/R levels for the week and month ahead, for SPX, SPY, NDX, QQQ, IWM, DJI, ES=F, NQ=F, GDX, SILVER, OIL, TSLA, NVDA, META, GOOG, MSFT, AAPL and AMZN. And in the Weekly Compass, the annual levels are charted for the securities mentioned, and DAX, Nikkei, Bitcoin and more. The latest publication for this week is here:

Since 2000 people are subscribed to this community, as a celebration I will share another free publication this week decoding the Fear and Greed index. Stay tuned!.
This market research and educational content is not intended to be investment advice.